Examples
We will give some examples how to transfer the MATLAB geometry to Omegalib. The MATLAB code is located in /local/examples/daMatlab/MATLAB.
Sphere (Quads)
As an example, let’s create a simple surface of a sphere in MATLAB.
As an example, let’s create a simple surface of a sphere in MATLAB.
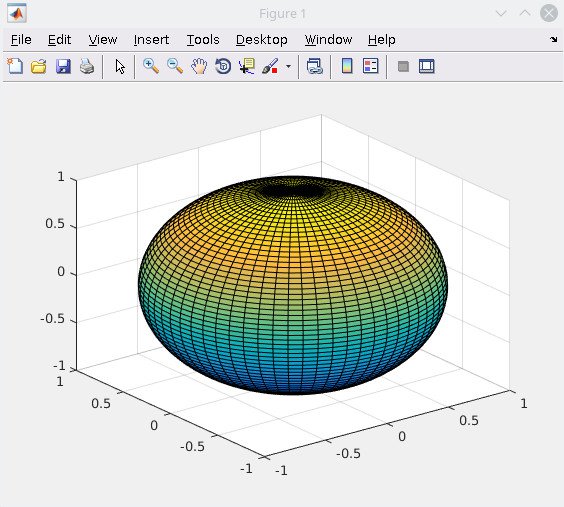

Sphere in MATLAB (surface with quads)
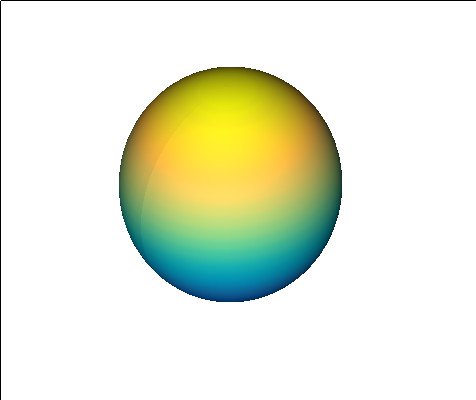

Sphere in Omegalib
We wrote some MATLAB functions to retrieve the geometry data from MATLAB-based graphic objects and to convert it into the required Omegalib format.
We can provide functions fetching vertices and faces, coloring, camera position and up-vector, and the normals. For instance, The MATLAB coloring is converted into a RGBA(red, green, blue, alpha) matrix. Currently, we can convert data from matlab.graphics.chart.primitive.Scatter, matlab.graphics.chart.primitive.Surface and matlab.graphics.primitive.Patch. Some of MATLAB’s graphic objects do not provide the normal values; therefore an external calculation might be necessary.
[faces, vertices] = getValues(fig);
colors = getColorValues(fig);
[camPos, camUp] = getCameraValues(fig);
[face_normals, vertex_normals] = getNormalValues(fig);
The server in the daMatlab module is listening on default port 30000 and IP address 127.0.0.1. After creating and initializing the socket, we send the compulsive commands H_MODEL_NAME and H_TYPE as well as the camera position and the up-vector.
u=udp('127.0.0.1', 30000);
fopen(u);

fwrite(u, strcat('H_MODEL_NAME:', 'Sphere'), 'char');
fwrite(u, strcat('H_TYPE:', 'QUADS'),'char');
fwrite(u, strcat('H_CAM_POS:', num2str(camPos)),'char');
fwrite(u, strcat('H_CAM_UP:', num2str(camUp)),'char');
To send geometry data, we first have to transmit the corresponding flag with the number of vectors as a value. Afterwards, the matrices containing the geometry data can be transmitted row by row.
count_vertices = size(vertices, 1);
count_faces = size(faces, 1);
count_colors = size(colors, 1);
count_vertex_normals = size(vertex_normals, 1);

V = num2str(vertices);
fwrite(u, strcat('D_VERTEX:',  num2str(count_vertices)), 'char');
for k=1:count_vertices
    fwrite(u, V(k,:), 'char');
end

V = num2str(vertex_normals);
fwrite(u, strcat('D_VERTEX_NORMAL:',  num2str(count_vertex_normals)), 'char');
for k=1:count_vertex_normals
    fwrite(u, V(k,:), 'char');
end

F = num2str(faces);
fwrite(u, strcat('D_FACE:', num2str(count_faces)), 'char');
for k=1:count_faces
    fwrite(u, F(k,:), 'char');
end

C = num2str(colors);
fwrite(u, strcat('D_COLOR:', num2str(count_colors)), 'char');
for k=1:count_colors
    fwrite(u, C(k,:), 'char');
end
After successfully transmitting the geometry, we have to add it to the queue by using the command H_ADD.
fwrite(u, 'H_ADD:', 'char');

fclose(u);
delete(u);
clear u;
Utah Teapot
A common example in computer graphics is the 3D model of a teapot. The data for vertices and faces can be downloaded from Stanford University and saved in a teapot.obj file. To read in obj files in MATLAB we have to use an external toolbox since it is currently not provided by MATLAB. For instance, we used the Geometry Processing Toolbox by Alec Jacobson and others, 2016.
path = 'external/gptoolbox-master/mesh/'; % path to the toolbox
addpath(path);
[vertices,faces] = readOBJ('teapot.obj');
We created a MATLAB class Omegalib that sends data from MATLAB graphic objects to Omegalib. It integrates the commands into the MATLAB figure object.
Teapot (Point Cloud)
ptCloud = pointCloud(vertices);
omgpt = Omegalib('teapot', 'POINTS');
setNormals(omgpt, 'VertexNormals', pcnormals(ptCloud));
plotFigure(omgpt, 1, @pcshow, ptCloud);
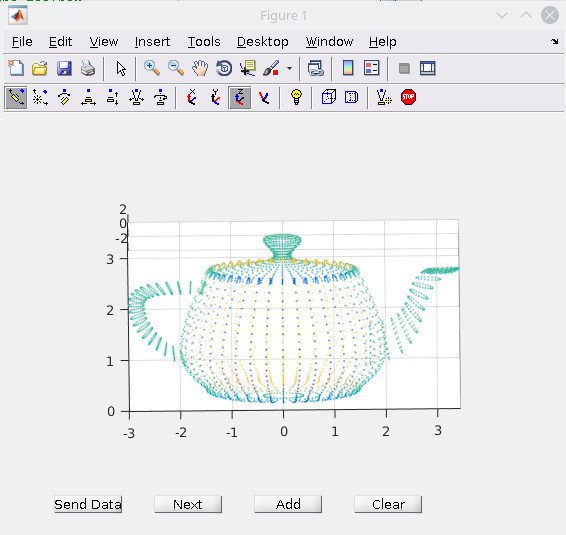

Teapot in MATLAB (point cloud)
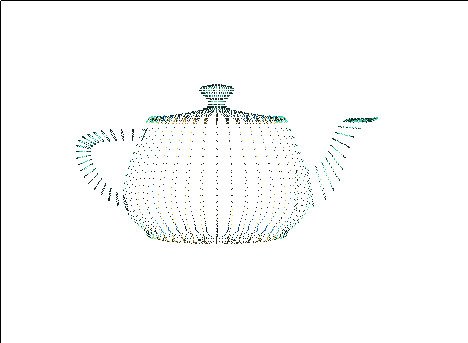

Teapot in Omegalib
Teapot (Triangles)
TR = triangulation(faces,vertices);
omgtri = Omegalib('teapot', 'TRIANGLES');
setNormals(omgtri, 'VertexNormals', vertexNormal(TR));
plotFigure(omgtri, 2, @trisurf, faces, vertices(:,1) ,vertices(:,2),vertices(:,3));
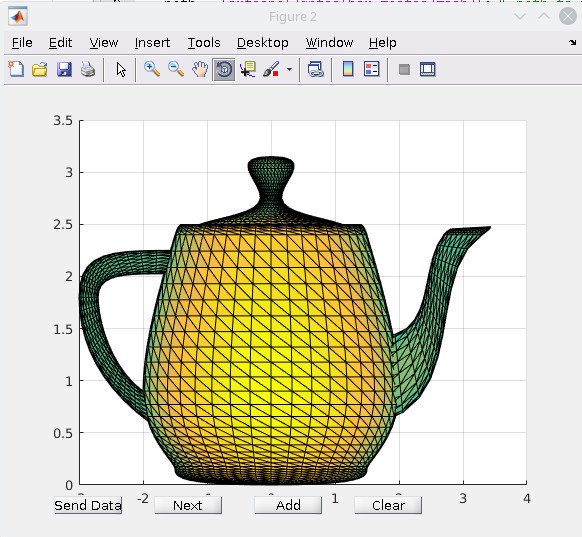

Teapot in MATLAB (surface with triangles)
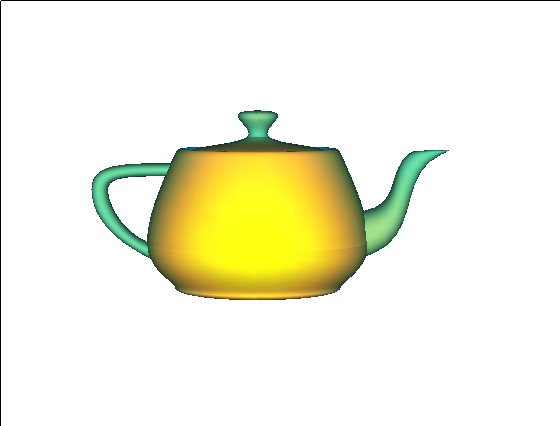

Teapot in Omegalib
Usage of H_NEXT
Let’s add two teapots into one ModelGeometry object.
TR1 = triangulation(faces,vertices);
omg1 = Omegalib('teapot', 'TRIANGLES');
setNormals(omg1, 'VertexNormals', vertexNormal(TR1));
plotFigure(omg1, 1, @trisurf, faces, vertices(:,1) ,vertices(:,2),vertices(:,3));

% Second teapot shifted by 10 units
TR2 = triangulation(faces, bsxfun(@plus, vertices, [10 0 0]));
omg2 = Omegalib('teapot', 'TRIANGLES');
setNormals(omg2, 'VertexNormals', vertexNormal(TR2));
plotFigure(omg2, 2, @trisurf, faces, vertices(:,1) + 10 ,vertices(:,2),vertices(:,3));
Press the buttons in the following order:
Figure 1: Send Data Figure 1: Next Figure 2: Send Data Figure 2: Add
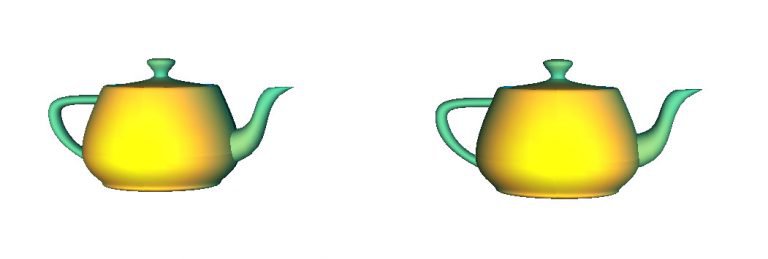

Two teapot objects in Omegalib