Using the Builder
We've written a simple Python-based build program that imports a CSV file you'd like to visualise, and generates a web page with your data visualised using parallel coordinates.
To continue, you'll need to have Python version 3 installed on your system, and to be able to run python in a terminal or shell environment on your computer. For example:
$ python --version
Python 3.10.3
Download the builder files
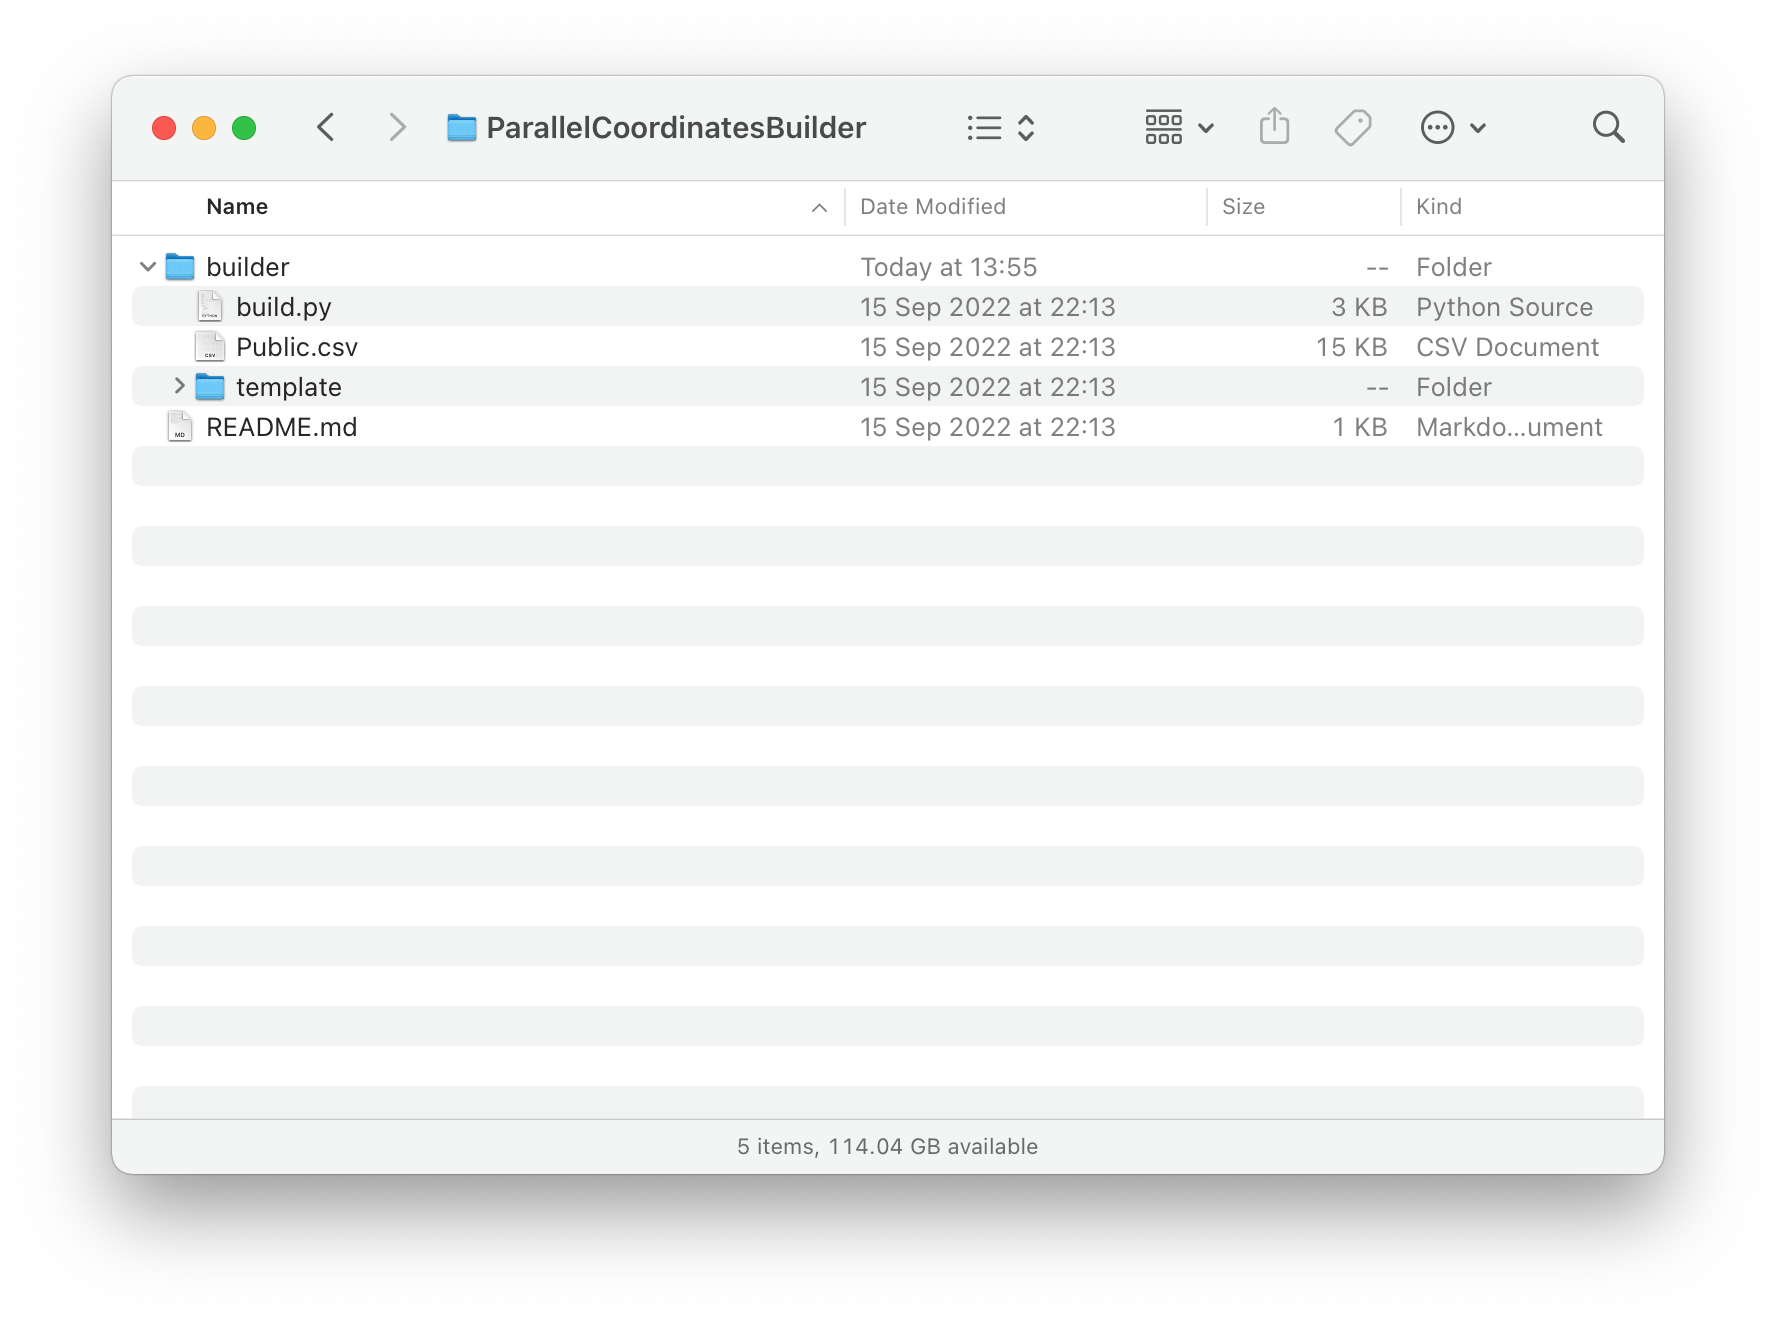
Download and unzip the builder files below. Inside you'll notice a builder folder which contains the build.py program, a template folder and a sample CSV file called Public.csv. We'll use this sample file in this tutorial, but you should replace it with a path to your own CSV file.
Create your web template
The build.py program requires a path to your CSV file, as well as the column name you would like to use to group your data. Any extra parameters are columns you would like to exclude from the visualisation.
Inside a terminal / shell window, cd to the builder directory:
cd /your/path/to/ParallelCoordinatesBuilder/builder/
Run the build.py file and include the path to your CSV file, the column name to use for grouping, and any extra columns to exclude:
./build.py Public.csv Institution name
You should see an output like below if the program has run successfully:
Using Public.csv file and 'Institution' as Group
Excluding columns: 'group'
()
Copied files to folder Public..
Wrote new json file Public/file/data.js
()
Detected column types:
('Ordinal', 'State', 'NSW')
('Ordinal', 'group', 'Local Government')
('Numeric', '2011', '4500')
('Numeric', '2010', '44500')
('Numeric', '2013', '40000')
...
...etc
('Numeric', '2005', '16000')
('Numeric', '2008', '30000')
('Numeric', '2009', '39000')
Saved to: Public/
Your website with the parallel coordinates visualisation will be saved to a folder called Public (or the name of your CSV file).