Creating a Bar Chart App in SAGE2
Have a read through the SAGE2 application API and Familiarise yourself with the SAGE2 applications located in /public/uploads/app. SAGE2 provides a default boilerplate for writing your application. Copy the template sage2/docs/templates to sage2/public/uploads/app.
If your SAGE2 environment is running, exit and restart your SAGE2 environment to upload the app and add it the internal navigation.
- Type
exitinto the terminal to stop the stage2 environment from running - Press up on the keyboard to reload the previous command, reenter.
node server.js default-cfg.jsonto restart the server - In Chrome navigate to
https://localhost:9090/index.html
Now you should see your default application to both the SAGE2 in app menu and external menu.
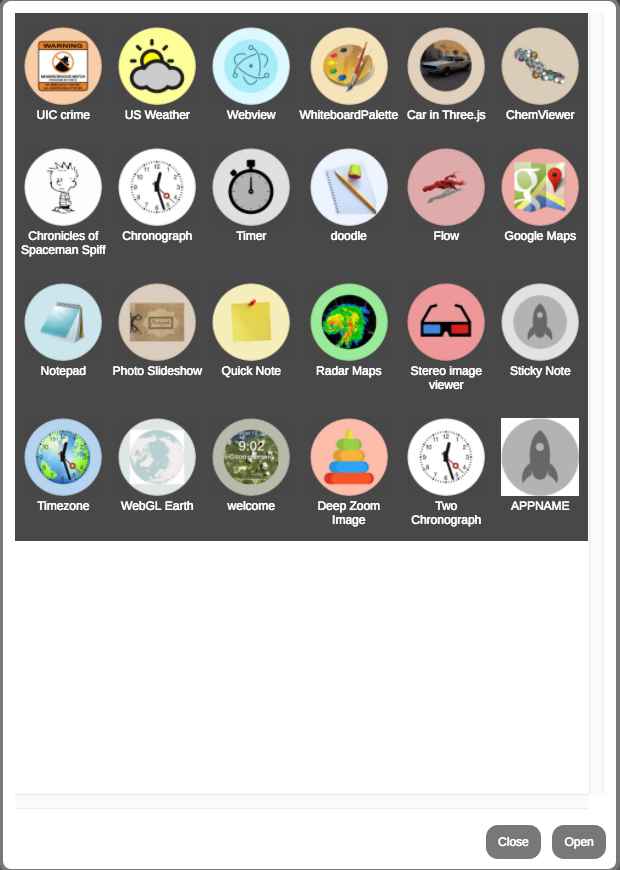
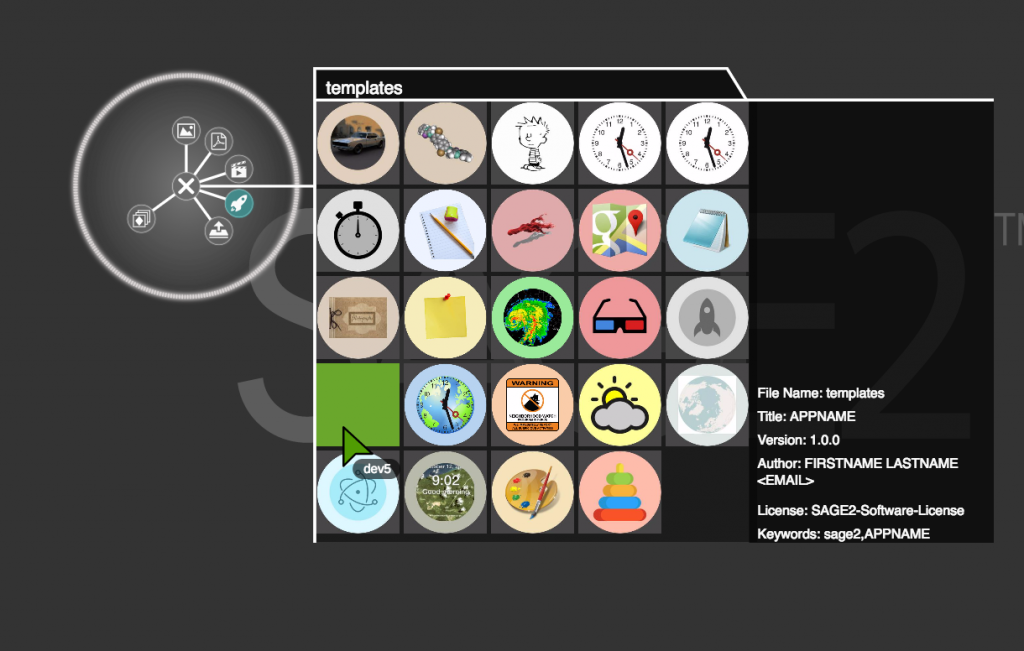
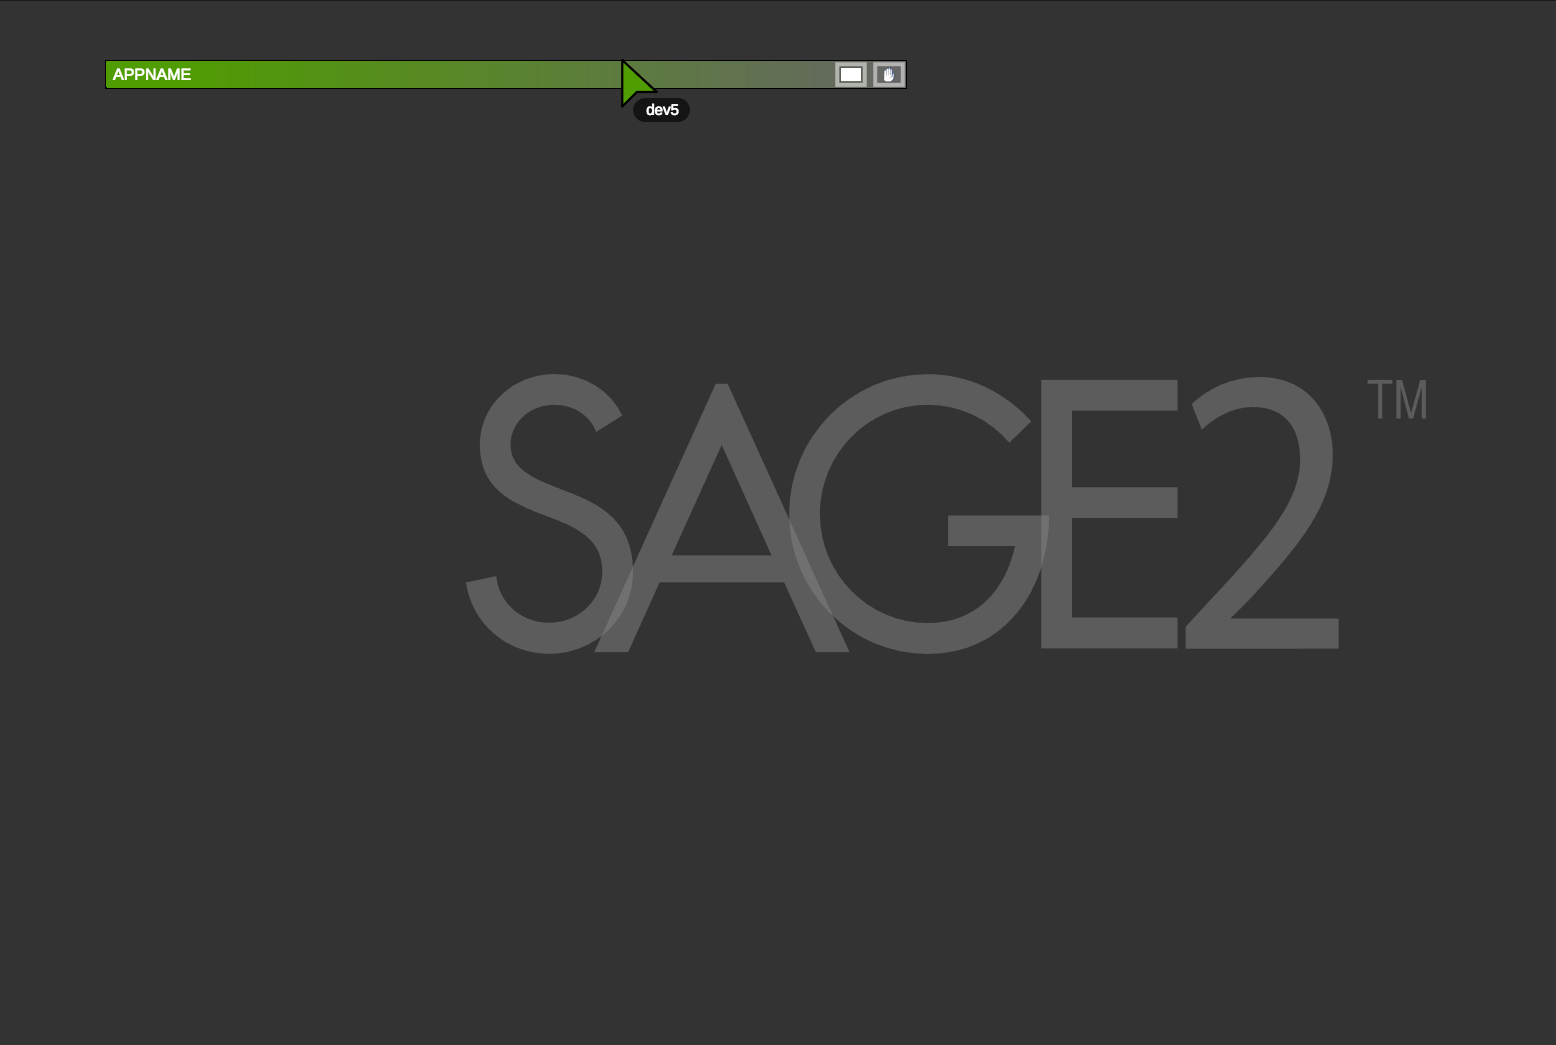
At this stage when you select “APPNAME” from the navigation menu you just see the top bar.
Customize your App
Change the name of the sage2.js file to something more relevant, as we are making a bar chart. I will rename the file to simplebar.js now it is important to edit the instruction script to reflect this change. There are a lot of things that can be edited in the instructions script, in this tutorial, we will change The Title, The Description, The script it links to main_script and the type.
- Edit
sage2.jsto besimplebar.js - Open the
instructions.jsfile - Change edit the name script property to reference your renamed script
simplebar.js - Edit
titleProperty Bar Charts
{
 "main_script": "simplebar.js",
 "icon": "sage2.png",
 "type": "object",
 "width": 700,
 "height": 1200,
 "animation": true,
 "dependencies": [
 ],
 "load": {
 "content": []
 },
 "fileTypes": [ "txt" ],
 "directory": "text",
 "title": "Bar Chart",
 "version": "1.2.3",

"description": "A simple bar chart",
 "keywords": [ "notepad", "collaborative", "text" ],
 "author": "Krishna Bharadwaj <krishnaknbharadwaj@gmail.com>",
 "license": "SAGE2-Software-License"
}
Full List of Properties
For more information on instructions.js have a look at the API. All properties are optional and are set with default values if not specified.
| Property name | Type | Values | Notes |
|---|---|---|---|
main_script |
string |
<path> |
The path to the file containing the application definition |
resize |
string |
'proportional', 'free' |
The resize mode of the window |
width |
int |
The width of the window in pixels | |
height |
int |
The height of the window in pixels | |
animation |
boolean |
unknown | |
sticky |
boolean |
unknown | |
dependencies |
[string] |
<path>, <uri> |
A list of dependencies of the application |
load |
object |
An object passed into the load function at startup | |
icon |
string |
<path> |
The file containing an application icon |
title |
string |
||
version |
string |
The current version of the application | |
description |
string |
A short description of the purpose of your application | |
author |
string |
||
license |
string |
The name of the license of the application | |
keywords |
[string] |
A list of keywords associated with the application | |
filetypes |
[string] |
A list of filetypes that the application can open | |
directory |
string |
unknown |
Adding A Library
The bar chart we will be written in d3 so it is necessary to add the d3 version 3 library to the uploads/lib folder. Copying the library to the /lib will add it as a global library and allow us to use d3 functions in all of our sage to apps. It is also possible to add local dependencies by editing the instructions.json script.
- Download
d3.min.js - Copy the file into sage2/public/lib
Writing the bar chart
Your default boilerplate should look like this:
var myApp = SAGE2_App.extend( {
    init: function(data) {
        // data: contains initialization parameters, such as `x`, `y`, `width`, `height`, and `date`
        this.SAGE2Init(<html-tag container for your app (eg. 'img', 'canvas')>, data);

        this.resizeEvents = "continuous";//see below for other options

        // initialize your variables
        this.myvalue = 5.0;
    },

    //load function allows application to begin with a particular state.  Needed for remote site collaboration.
    load: function(date) {
        //your load code here- update app based on this.state
    },

    draw: function(date) {
        // application specific 'draw'
        this.log("Draw");
    },

    resize: function(date) {
        // to do:  may be a super class resize
        // or your resize code here
        this.refresh(date); //redraw after resize
    },

    event: function(type, position, user, data, date) {
        // see event handling description below

        // may need to update state here

        // may need to redraw
        this.refresh(date);
    },

    move: function(date) {
        // this.sage2_x, this.sage2_y give x,y position of upper left corner of app in global wall coordinates
                // this.sage2_width, this.sage2_height give width and height of app in global wall coordinates
                // date: when it happened
        this.refresh(date);
       },

    quit: function() {
        // It's the end
        this.log("Done");
    }
});
Now we will edit the boilerplate to reference your new app. Edit the myApp variable to and change it to the name of your app:
var simplebar = SAGE2_App.extend( { //...etc
init: function
this.SAGE2Init(“div”, data); creates a div in our SAGE2 application. We want to change this to an object so when we create our SVG container we can append it the object. In standard d3 code, we would append to the body of an HTML document.
d3.select("body").append("svg")
Create a json file
The bar chart we are building will reference a JSON File more information Create the .json file by opening a blank file and copying in this information, then save it as mydata.json within your simple bar app folder:
[
 {"name": "Marie", "age": 12, "height": 3.2},
 {"name": "Marie", "age": 15, "height": 4.2},
 {"name": "Marie", "age": 57, "height": 5.9},
 {"name": "Fred", "age": 21, "height": 5.2 },
 {"name": "Fred", "age": 23, "height": 7.3 },
 {"name": "Francis", "age": 14, "height": 4.3 },
 {"name": "Francis", "age": 22, "height": 5.3 },
 {"name": "Francis", "age": 35, "height": 8.4}
]
D3 Code
For more information on learning d3 have a look at our d3 !!!resource page. Add in your D3 Code under the init: function:
//d3.select("object") appeneds the svg to object we just created above.
var svgContainer = d3.select("object").append("svg")

//width and height should be the same as your instructions file alternatively you could set it to %100
 .attr("width", "700")
 .attr("height", "1200");

//within sage2 it is important to put the full path of your JSON file to find out your full path open
// the terminal and type pwd in the simplebar app folder

 var chartgroup = svgContainer.append("g");
 d3.json("/full/path/mydata.json", function(data){

chartgroup.selectAll("rect")
 .data(data)
 .enter().append("rect")

 .attr("height",function(d, i){ return d.age*5; })
 .attr("width","50")
 .attr("x",function(d, i){ return 60*i;})
 .attr("y",function(d, i){ return 300-(d.age*5); });

})
Now save and close simplebar.js and relaunch the SAGE2
- Type
exitinto the terminal to stop the stage2 environment from running - Press up on the keyboard to reload the previous command, reenter.
node server.js default-cfg.jsonto restart the server - In Chrome navigate to
https://localhost:9090/index.html
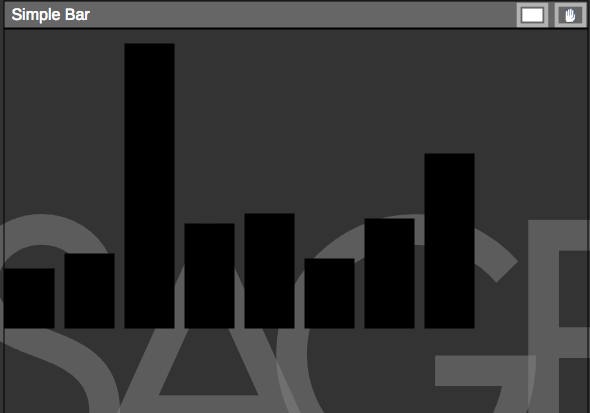
Bar Chart