D3 (Data-Driven Documents)


“D3.js is a JavaScript library for manipulating documents based on data. D3 helps you bring data to life using HTML, SVG, and CSS. D3’s emphasis on web standards gives you the full capabilities of modern browsers without tying yourself to a proprietary framework, combining powerful visualization components and a data-driven approach to DOM manipulation.”
How does it help with visualisation?
“D3 allows you to bind arbitrary data to a Document Object Model (DOM), and then apply data-driven transformations to the document. For example, you can use D3 to generate an HTML table from an array of numbers. Or, use the same data to create an interactive SVG bar chart with smooth transitions and interaction.
D3 is not a monolithic framework that seeks to provide every conceivable feature. Instead, D3 solves the crux of the problem: efficient manipulation of documents based on data. This avoids proprietary representation and affords extraordinary flexibility, exposing the full capabilities of web standards such as HTML, SVG, and CSS. With minimal overhead, D3 is extremely fast, supporting large datasets and dynamic behaviors for interaction and animation. D3’s functional style allows code reuse through a diverse collection of components and plugins .”
Examples
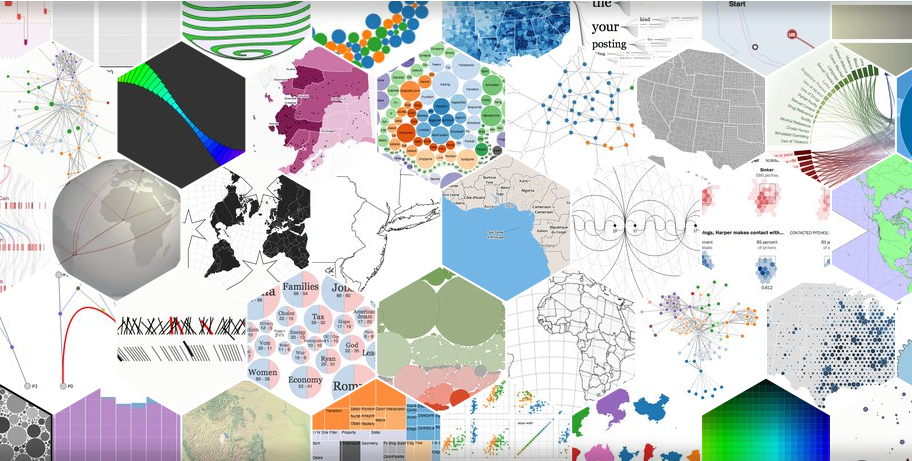
A range of examples are available within the d3 GitHub gallery and at bl.ocks.org/mbostock.
Learning D3
Recommended skills/programming experience
A basic understanding of HTML and CSS would be helpful before driving into d3.js. Knowledge of JavaScript would also be useful but is not mandatory in order to learn how to make use of this library.
- HTML
- CSS
- JavaScript
Getting Started
The official D3 documentation, tutorials and an API reference are available online. A training course entitled Data Visualization with D3.js is also available through lynda.com.
Additionally, d3Vienn on YouTube provides a series of free video tutorials for beginners who wish to learn how to use D3:
Integrating D3 examples into Data Arena pipelines
We have created the parallel coordinates pipeline to work within the Data Arena and the DAVM. You may be able to modify this pipeline to export your data to one of the other D3 visualisations. Pipelines for some of the other D3 visualisations are currently under development.
Display your project in the Data Arena
D3 projects can be displayed on a web page. It is possible to access a live site from within the Data Arena. Alternatively, it is possible for you to provide a .html file to load manually.