| Year | 2018 |
| Credits | Mao Lin HuangSchool of SoftwareResearch Team Christy Jie LiangSchool of SoftwareResearch Team Tze-Haw HuangSchool of SoftwareResearch Team Gang LeiSEDEResearch Team Shakil Ahamed SkanSEDEResearch Team |
| 3D Stereo | No |
| Tags | blockchain d3 |
Visual BlockChain Research
This research mission lies in the good understanding the nature of block-chain technology, and investigating underlying reasons behind transactions, and identifying the relationships between different parties.
BlockChain Visualization offers opportunities to let us to see, understand and explore blockchain, and answer a great number of unanswered questions, which are complicated by the growth of digital currency and the misunderstanding of its underlying principles.
The Visual Analytic System utilizes the data arena to show a changing relationship between individuals and organizations, including financial institutions, regulators, banks, and governments. Users explore, integrate and streamline BlockChains into potential different business processes.
To meet the challenges, we developed a collaborative visual analytics platform in data arena. The system has ability to integrate heterogeneous data on a same platform, including transaction data, news data, and financial data etc.
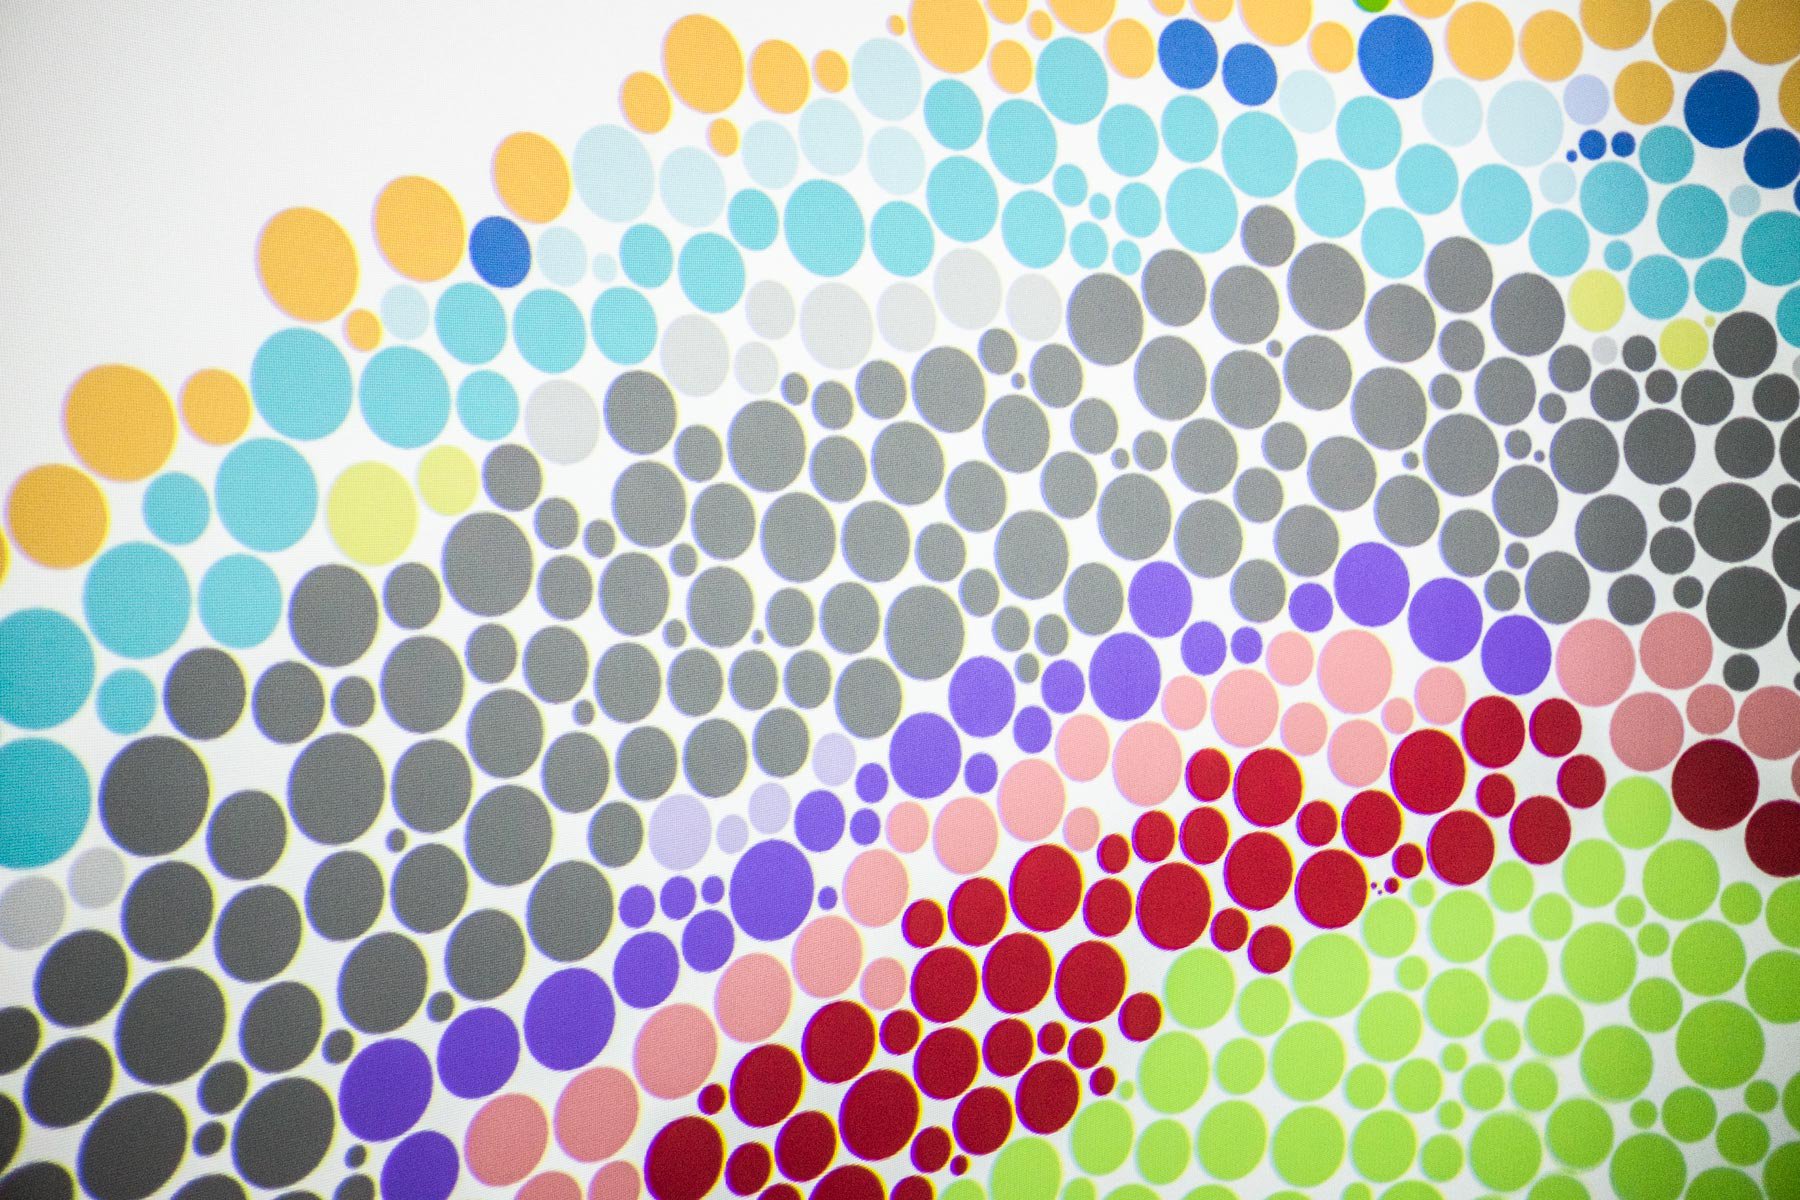
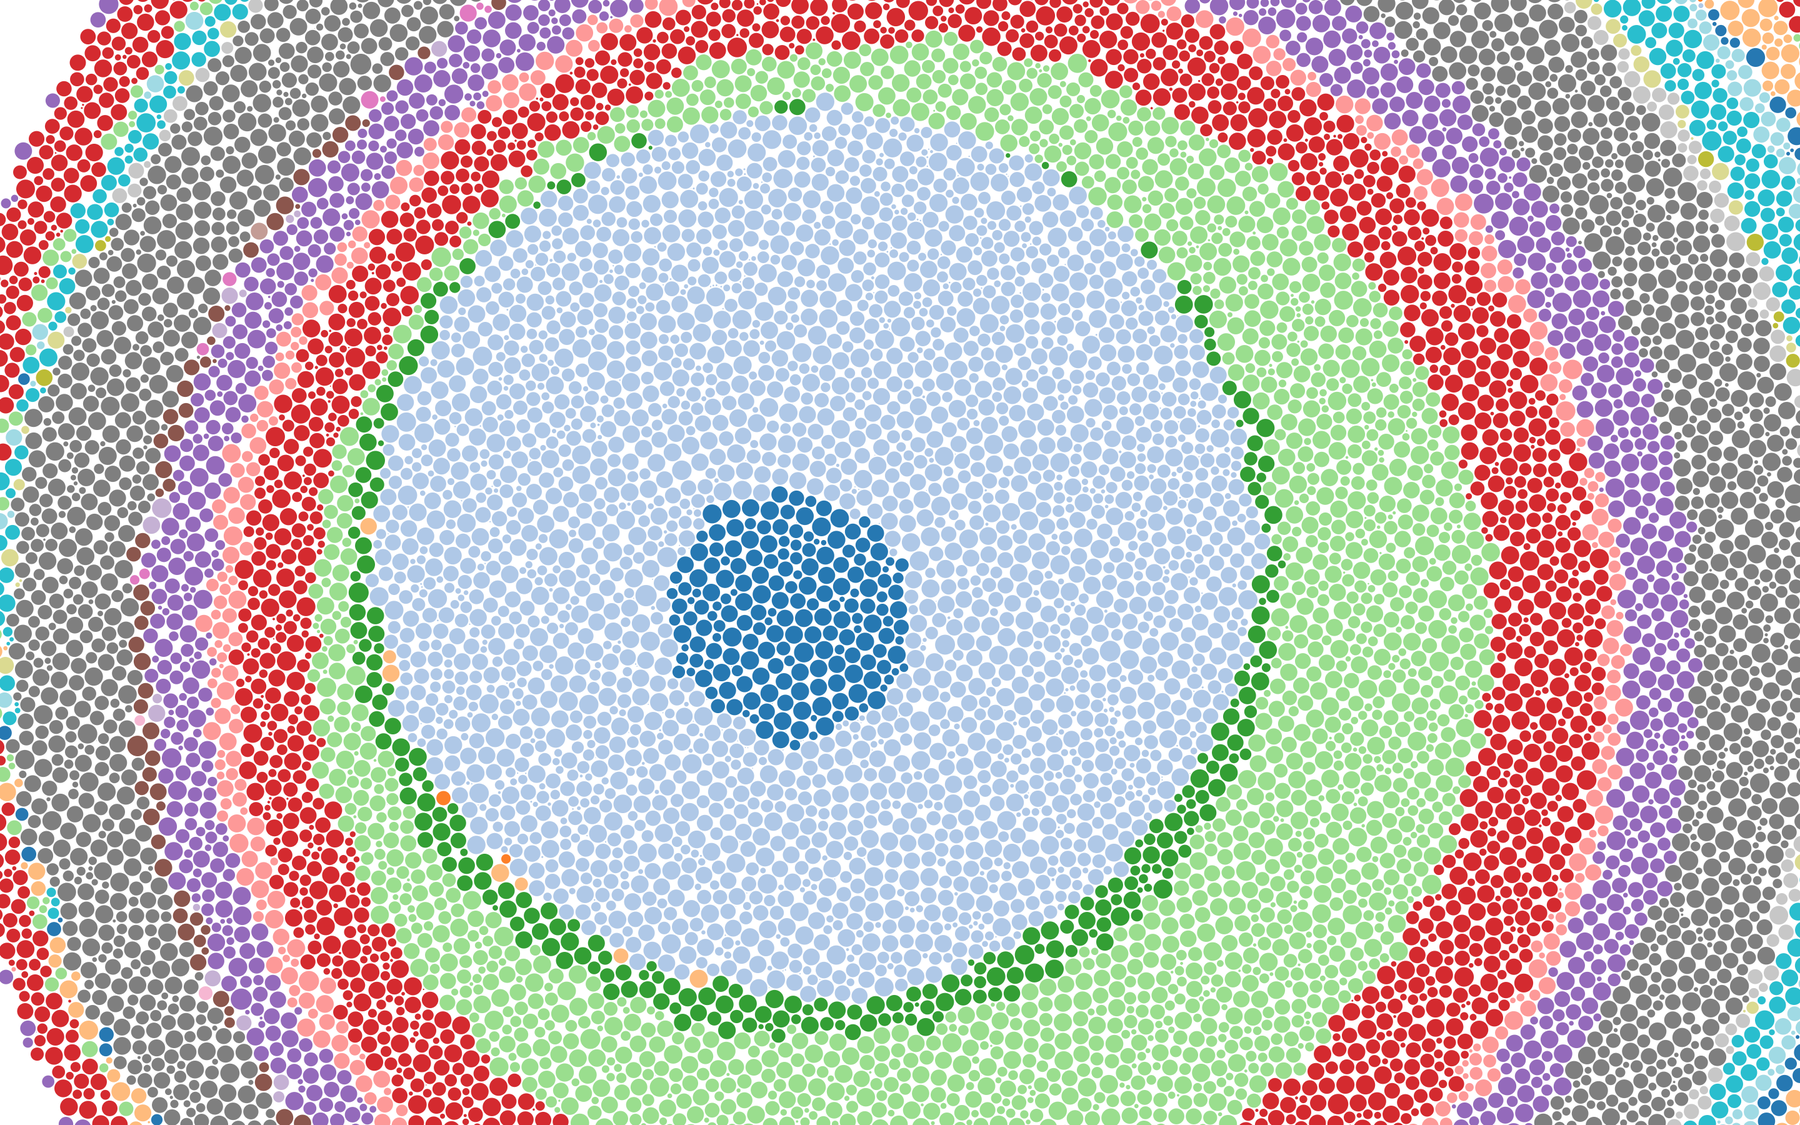
We introduce a novel interactive visualization method to assist users to explore and investigate the journey of blockchain based on heterogeneous data, through interactive visual exploration.
It offers a visual exploration, and analysis of nodes, blocks and chain in the networks and events and conversations in the blockchains.
In order to discover the unknown insights & debate questions, we employed interactive visualization and deep-learning techniques in Data Arena to discover transactions, transaction patterns and abnormal events through the sharing of the auditable transaction history created by previous practices.
Background
BlockChain technology has pioneered a new approach to record, store and track every transaction made in a digital ledger “database”, which is shared by all parties via a distributed peer-to-peer (P2P) network.
This decentralised ledger system has transformed a changing relationship between individuals and organizations, including financial institutions, regulators, central banks, and governments.
Existing users and potential ones are to explore how to integrate and streamline BlockChain technology into different business processes, financial services, and other applications. BlockChain technology offers opportunities to replace traditional business rules, but also raises a great number of unanswered questions.
The debates are complicated by the growth of digital currency and the misunderstanding of its underlying principles.
Blockchains in the Data Arena
This research aims to understand the nature of digital currency and block-chain, investigate the underlying reasons behind block-chain transactions, and identify the relationships between different factors which may impact transactions or events.
In later stages, larger scale of data, multiple-data sources (structure and unstructured) and evolving transaction/events will dramatically increase the complexity of data, where classical data visualization methods in a small display tend to be inadequate.
We propose a new visualization method, for use in the data arena, to meet challenges:
- Scalability problem: we investigate dynamic visualization method to handle the display of a large amount of nodes and links with a high quality of readability and a reasonably lower computational cost.
- Interaction (or navigation) problem: we investigate appropriate interaction methods to cooperate with the above visualization method. We need to deal with the multiple windows, zooming andview refinement problems.
- Visual Analytics problem: we investigate appropriate interaction methods for discovering explicit/implicit transaction patterns and abnormal events from the digital ledger “database”.
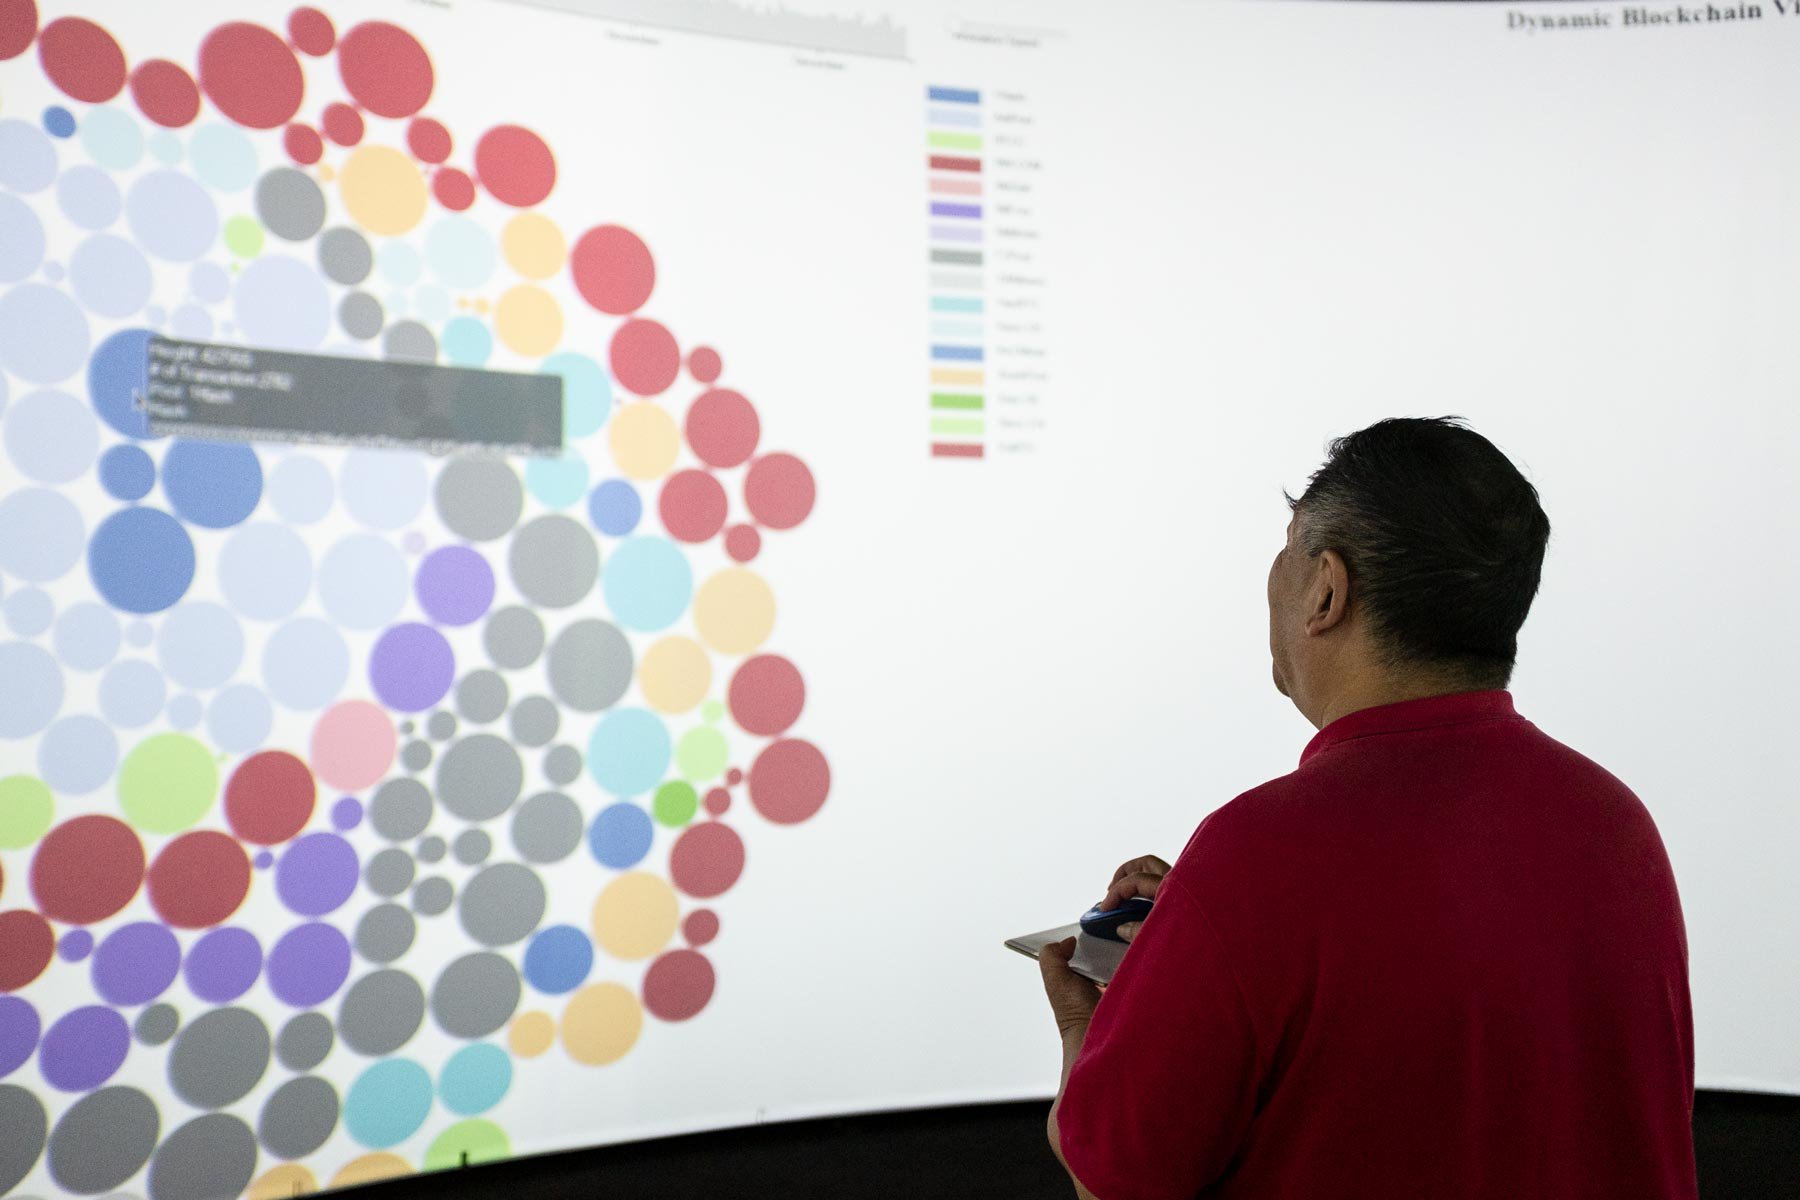
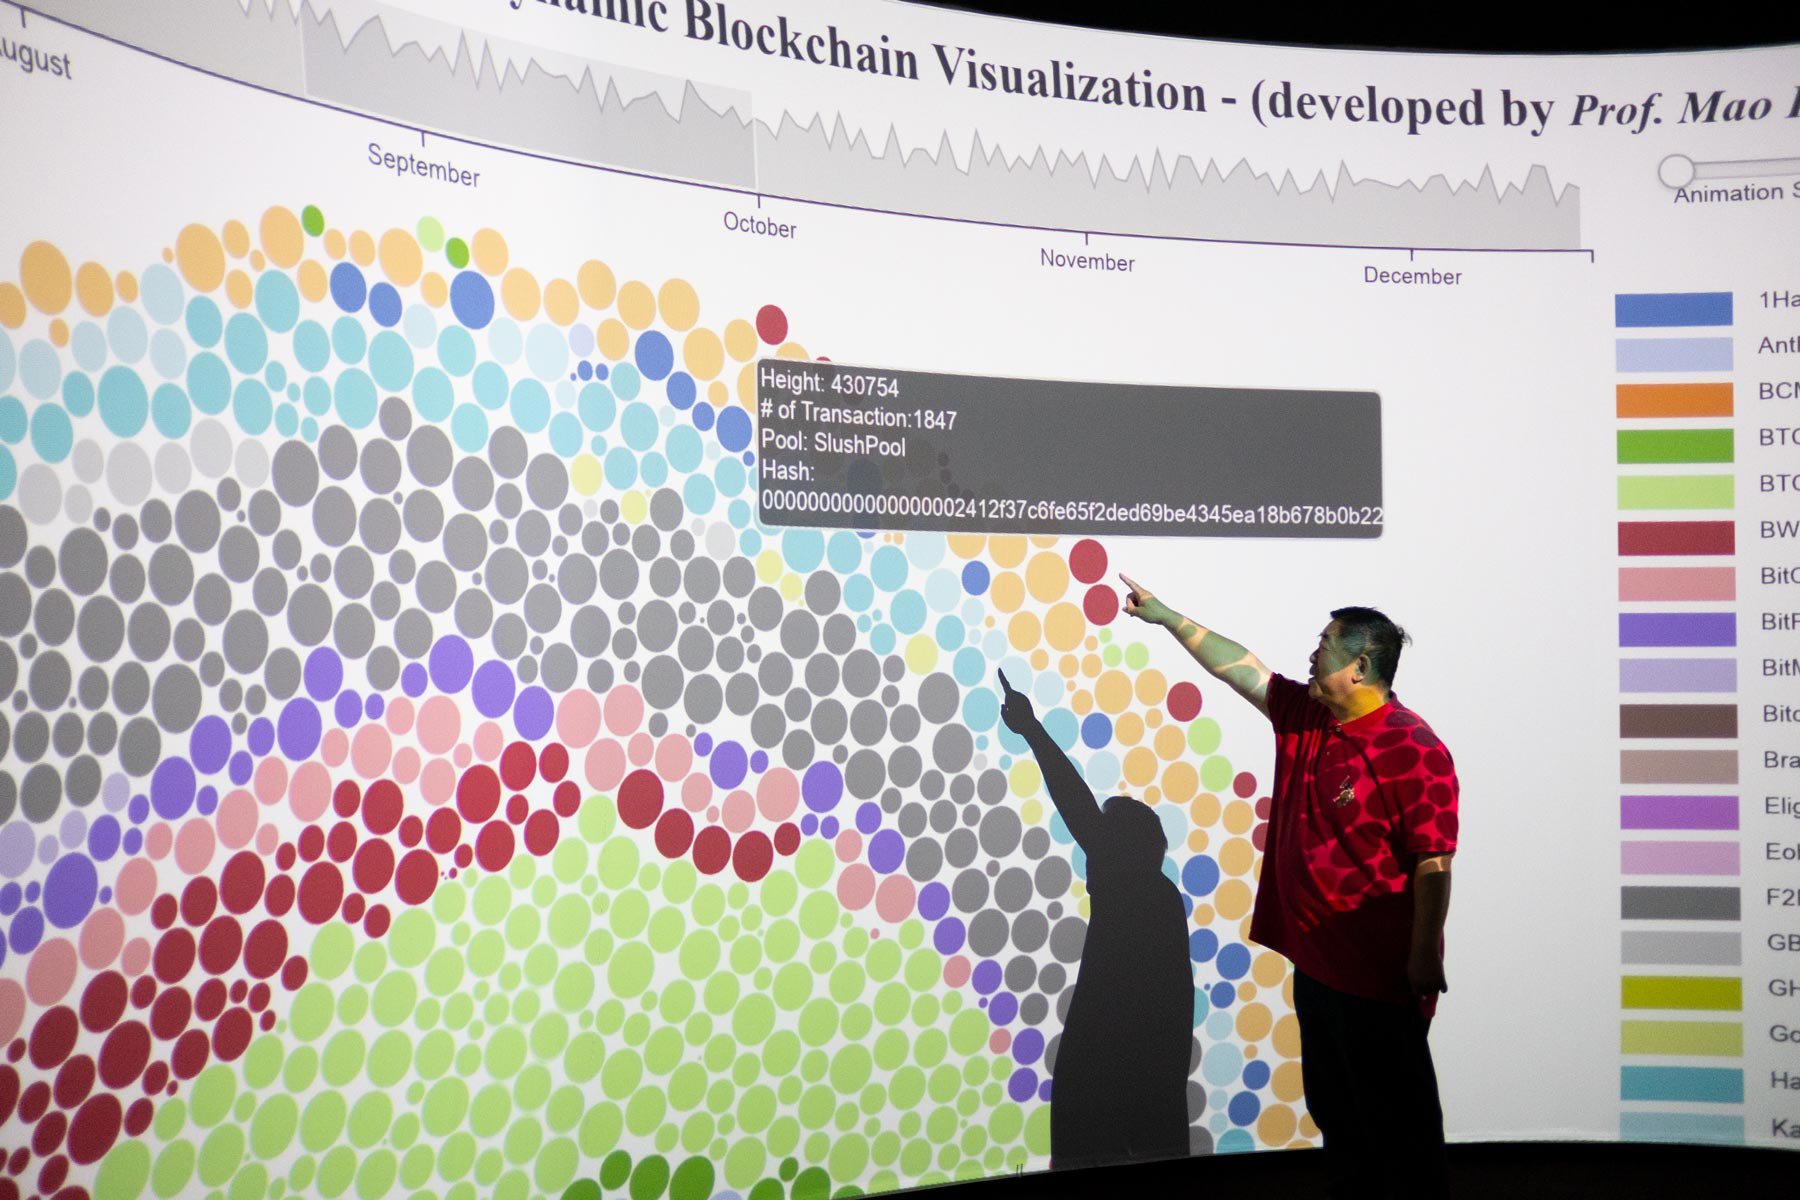
We use the big screens in Data Arena to:
- validate, investigate, and exhibit our findings in the history and real time visualization, and
- to discover further unknown questions.
Potential Outcomes
To contribute Data Visualization research, we proposed new visual analytic methods to build bridges which allow individuals and groups of users not only to observe, explore, discover in history and real-time blockchain visualization network, but also to predict and forecast the event-based patterns.
In the financial sector, the project will contribute to the good understanding the knowledge of block-chain technology, and investigating underlying reasons behind transactions, and identifying the relationships between different parties.
This research programme at the UTS School of Computer Society is on-going. If you are interested, please contact Dr Christy Jie Liang Jie.Liang@uts.edu.au