| Year | 2017 |
| Credits | Domenic RaneriCrime Scene Reconstruction Specialist, Forensics Imaging, NSW PoliceLiDAR Scan Capture Dr Jennifer RaymondResearch Co-ordinator, NSW Police Forensic Services Group Darren LeeOmegalib Programming Ben SimonsTech Lead |
| Links | |
| 3D Stereo | Yes |
| Tags | LiDAR big data |
Driver Avenue is LiDAR data
Driver Avenue is the street which runs along the front of the Sydney Cricket Ground (SCG) and Fox Studios in Sydney Australia. The data shown here was created during a field-test of a LiDAR scanner. It was scanned in an afternoon by a Crime Scene Officer from the Forensic Imaging Section of the NSW Police Force.
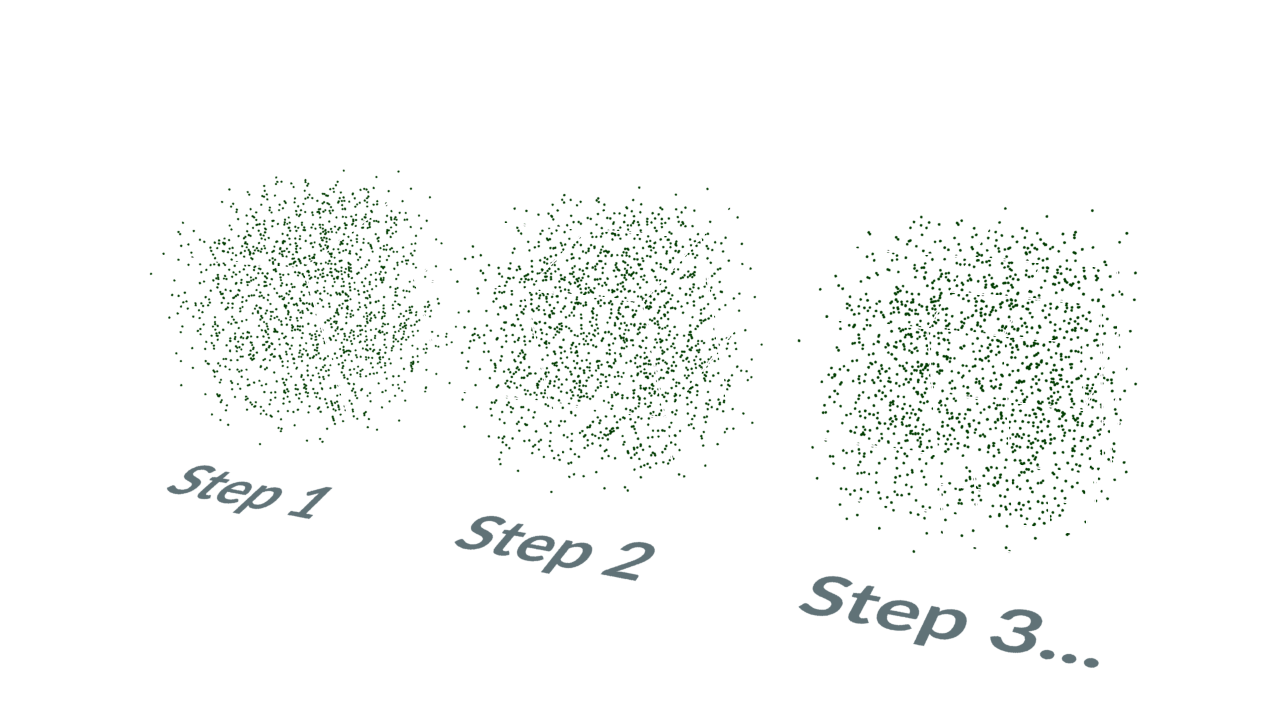
LiDAR is essentially "Laser Radar"; a radar which uses light instead of sound to determine the distance of things. A LiDAR will send out a beam of light and wait for a reflection. When it sees a reflection it knows how far away that hit-point must be by the laser's "time of flight". Further distant objects take longer. Of course, a laser being a beam of light, this time is very short - but it works. If you send out lots of beams, you get lots of points, and can scan a scene. That's what you see here. In this case 400,517,273 points!
Data Format
This particular LiDAR has a second camera on it which detects colour. When the LiDAR sees a reflection, it uses the 2nd camera to record the colour at that position. So in fact the LiDAR captures the position of the reflection in (x,y,z) and it captures the colour in (r,g,b).
If you were to see this data in a spreadsheet, you might see 6 columns like this:
| X | Y | Z | R | G | B |
|---|---|---|---|---|---|
| 134.00481 | 150.00949 | 78.17165 | 127 | 124 | 120 |
| 133.30797 | 149.93364 | 78.03493 | 120 | 119 | 120 |
| 134.02099 | 149.99706 | 78.42342 | 127 | 124 | 120 |
| 134.02269 | 149.99794 | 78.67873 | 128 | 127 | 122 |
| 132.59625 | 149.92382 | 78.71306 | 132 | 128 | 126 |
| 132.18378 | 149.96152 | 78.03933 | 119 | 117 | 114 |
| 132.18770 | 149.95792 | 78.28114 | 128 | 126 | 126 |
| 132.17240 | 149.97688 | 78.52623 | 126 | 125 | 124 |
| 132.17531 | 149.97439 | 78.76812 | 132 | 130 | 130 |
| 131.51948 | 149.91885 | 78.87464 | 133 | 132 | 131 |
| : | : | : | : | : | : |
| : | : | : | : | : | : |
Except imagine a million rows - this Driver Ave dataset would have 400 Million rows. LiDAR data will likely be in a common file format such as .LAS, the compressed version .LAZ, and sometimes in .e57 format.
This is an example use of the PointCloud Pipeline.
As you can see the Data Arena is able to fly-through these large point-clouds in realtime. Viewers can explore the 3D space scanned. The scan is fairly accurate; points are within 3mm accuracy - and there are many points. The gap between points is typically less than 1cm. Enough points to make a car number plate readable.
We have some tutorials on how to pre-process your pointcloud data into an Octree and SceneGraph [link]
Pre-processing
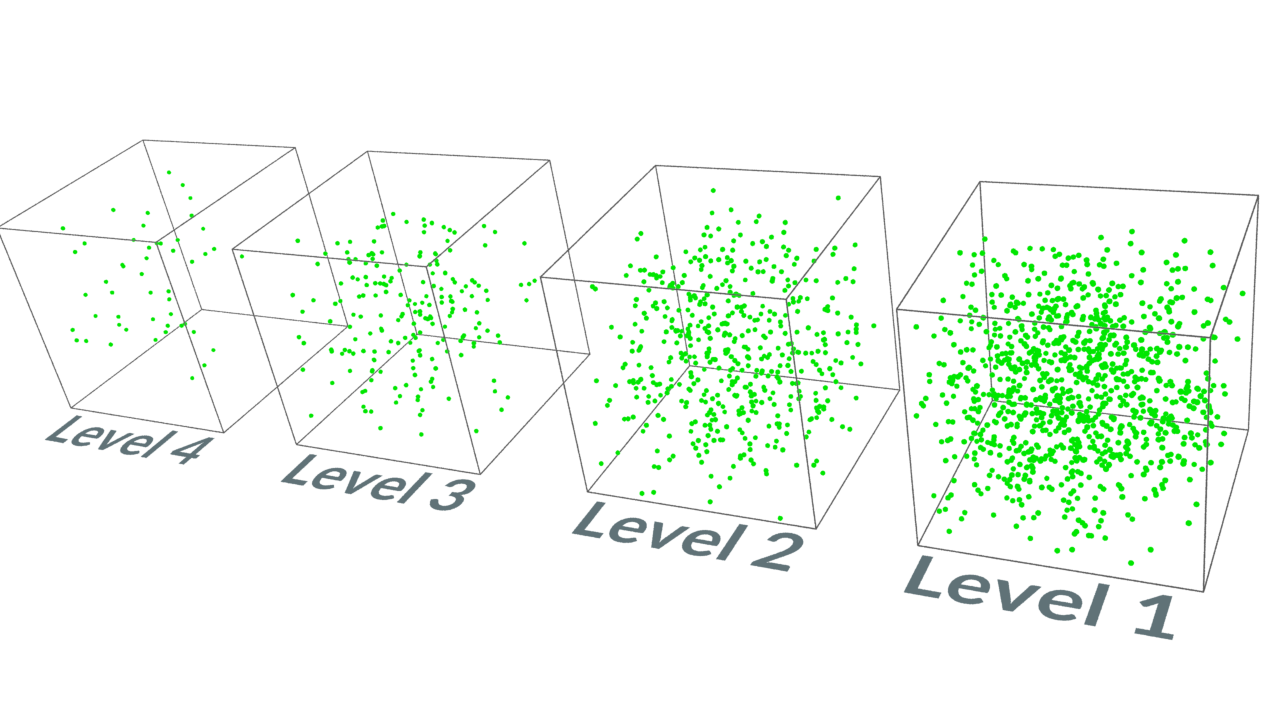
Every computer system will have some limit. Although the Data Arena is quite powerful, it also has a limit to the number of points it can display. In order to maintain a reasonable display frame-rate, these point clouds are pre-processed into Levels of Detail. The process essentially uses an Octree and Scene Graph.
The Octree process divides the point cloud into many many cubes. Imagine the entire point-cloud inside a box. Now divide that box in half and half and half, to make two then four, then eight sub-boxes. Then keep dividing boxes into smaller boxes until there are say 1000 points in the smaller box. If there's more than 1000, split it again.


Once this division is done, for each box there can be 4 different levels of detail. Say 1000 points, and then sub-sampled versions with 500, 200, and 50 points.


Finally, at "run time" when we want to display these points, the points in boxes which are near us ("the camera") are displayed at full-resolution - 1000 points. However those boxes which are not so close, we might choose to instead display one of the simpler versions. The furthest boxes we would show the version with 50 points. It's so far away, 50 points looks fine. In fact, if it is too far away, say more than a kilometre, perhaps we don't display those points at all.
All these "Level of Detail" (LOD) versions can be kept in a scene graph, used by Omegalib. See the tutorials on OmegaLib and Scene Graphs (openSceneGraph) for more information.
In doing this we can handle an unlimited number of points - as long as they are preprocessed in this manner. Level of Detail pre-processing is part of the Data Arena's PointCloud Pipeline.
Display
In the Data Arena, this data is viewed in 3D Stereoscopic mode. Active Shutter glasses allow the viewer to see seperate images for the left and right eye. The Data is rendered in stereoscopic depth such that close point appear to float in space, in front of the screen. The sensation is immersive.
Motion through the space is controlled by a space navigator [link]
Uses
The NSW Police use their LiDAR camera to capture significant traffic accidents and crime scenes. The data recorded can precisely capture the position of vehicles on a street, and the location of objects in a room. The data can be thought of as a 3D Photograph. It is possible that in the future, a Court Jury might be called into a 3D theatre the equivalent of the Data Arena to view a LiDAR Crime Scene.
LiDAR is commonly used to capture the entire location from a Feature Film-Set so that Visual Effects can be added in post production. Architects use LiDAR to capture existing buildings. An archeologist might use a LiDAR to scan a dig-site. Aerial Photogrammetry commonly uses LiDAR.
Join the dots to make polygonal surfaces. However, the point clouds are becoming so dense, the creation of a mesh from the points is almost unnecessary.
The Pointcloud Data
While we have permission to show this dataset, it is not available for redistribution.
Since Feb 2019 Domenic Raneri has coorinated a unit in Advanced Forensic Imaging as part of undergraduate studies in Forensic Science at UTS (University of Technology Sydney).
There is another smaller pointcloud dataset (22 million points) of the Victoria Arch at the Wombeyan Caves which is available. A LiDAR was attached to a drone and then flown through the cave. An even smaller version of this data is included as an example in the DAVM. They all use the same software - the PointCloud Pipeline