UTS Data Arena
  • home
  • projects
  • dive in
  • about
  • calendar
UTS Data Arena
projectsdive inaboutcalendar

Wiki


  • Contents
    • Introduction
    • Unreal Engine
      • Version & OS Support
      • The Development Process
      • Naming and Renaming Projects
      • Prepare your Project on our Workstations
      • Add the DA Assets Plugin
        • Add a Space Mouse Camera
        • Use the Space Mouse Axes and Buttons
        • Use Live Motion Capture Trackers
      • Package Your Project
      • Deploy Your Project to the DA
      • Run Your Project in the DA
    • Videos and Movies
    • Presentations
    • Web Projects
    • Tableau
      • What is Tableau?
      • Create a Dashboard for the Data Arena
      • Bring in Your Work
      • View Your Work
      • Glossary of Terms
    • Photo & Video Shoots
    • Software
    • Audio
      • Hardware
      • Software
        • Reaper Mixing
    • Mocap and Tracking
    • 360 Camera and Nuke
    • Visualisation Software
      • Blender
      • D3 (Data-Driven Documents)
        • RAW
        • Vega & Vega-Lite
      • Drishti
      • Google Software
        • Google Charts
        • Google Maps
      • Houdini
      • Leaflet
      • LibreOffice
      • Livre
      • MATLAB
      • Mayavi
      • Paraview
      • Protovis
      • Tableau
    • Data Formats
    • Reference
      • Analytics Tools
        • Drishti
        • Houdini
        • LibreOffice
        • Livre
        • MATLAB
        • ParaView
        • Tableau
        • VisIt
      • System
        • Bino
        • Cyclops
        • Equalizer
        • Gentoo Linux
        • Omegalib
        • OpenAL
        • OpenSceneGraph
        • Python
        • PyAL
        • VirtualBox
        • VRPN
    • Tech Specs
    • Ytini for Houdini

Protovis

protovis.png

What is Protovis?

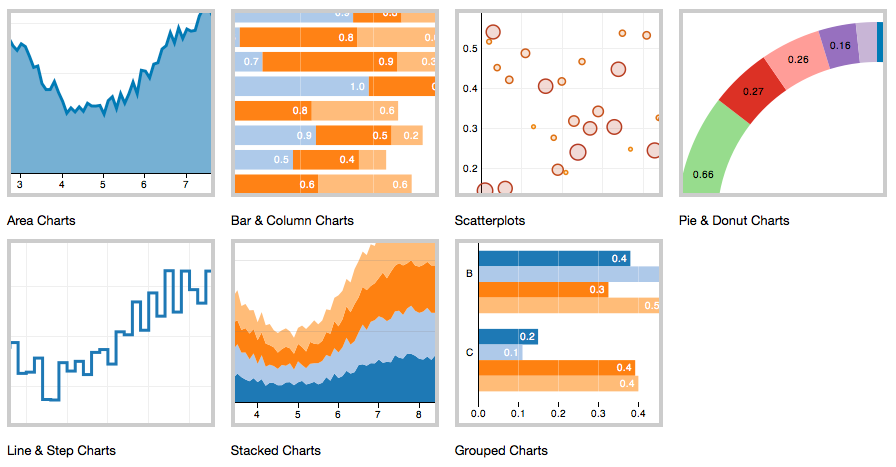
“Protovis composes custom views of data with simple marks such as bars and dots. Unlike low-level graphics libraries that quickly become tedious for visualization, Protovis defines marks through dynamic properties that encode data, allowing inheritance, scales and layouts to simplify construction.”

Protovis vs D3?

“Protovis is no longer under active development.

The final release of Protovis was v3.3.1 (4.7 MB). The Protovis team is now developing a new visualization library, D3.js, with improved support for animation and interaction. D3 builds on many of the concepts in Protovis; for more details, please read the introduction and browse the examples.”

Learning Protovis

Protovis examples and documentation is available online if you wish to learn more. We would suggest learning more about D3.js however, as Protovis is no longer being actively developed.

How to display your project in the Data Arena?

Protovis projects can be displayed on a web page. It is possible to access a live site from within the Data Arena. Alternatively, it is possible for you to provide a .html file to load manually.

Last updated 29 Aug 2019
Paraview
Tableau