Adding Years
Now that we have a single year responding to colour, we’re ready to tweak our network to visualise the entire table. For this tutorial we’re going to create concentric circles expanding from the middle. We basically want to copy this shape we already have and expand the circle size each time, but without duplicating our colour information. Have a look at your network and think about at what point we should start duplicating.
We need to add a copy SOP after we’ve constructed our carved and resampled circle, but before our attribute and colour nodes. This way our attribute create node and its friends can deal with the individual segments per year rather than treating each year as an entire copy. Make some room in there and add a copy node.
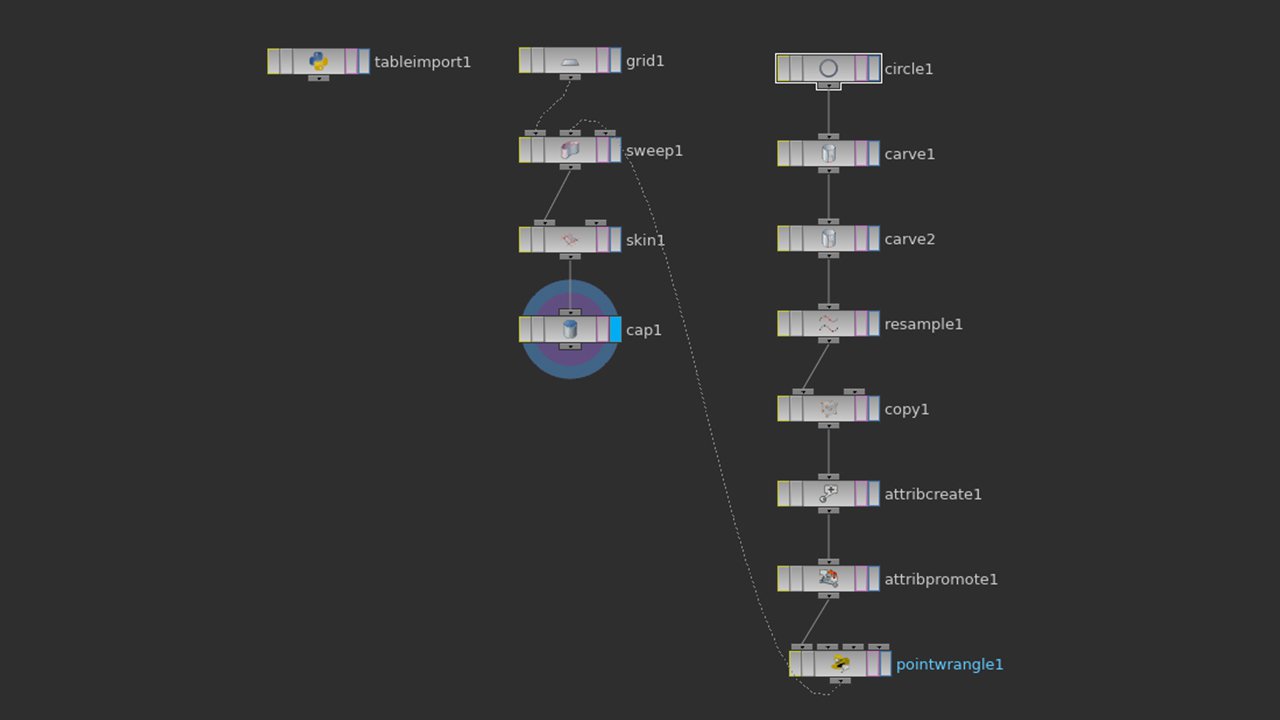

Position of copy node
Let’s set the amount of copies to ten for now. Try adjusting the uniform scale in copy. You’ll probably notice while it’s working, each ring is an extended distance from the one before it; not quite what we want. We don’t want to transform cumulatively, so uncheck that, and to avoid our copies ending up in the same location, we need to access the current copy number variable and scale with that instead.


Uniform scale set to 1.1, transforming cumulatively
CY is what we want, so entering $CY in uniform scale (or any other transform) will modify our geo according to the current copy number. CY starts at 0 which we don’t want, and our rings are also a little too spacious, so let’s fix this with a few math operations: 1 + $CY * 0.2.
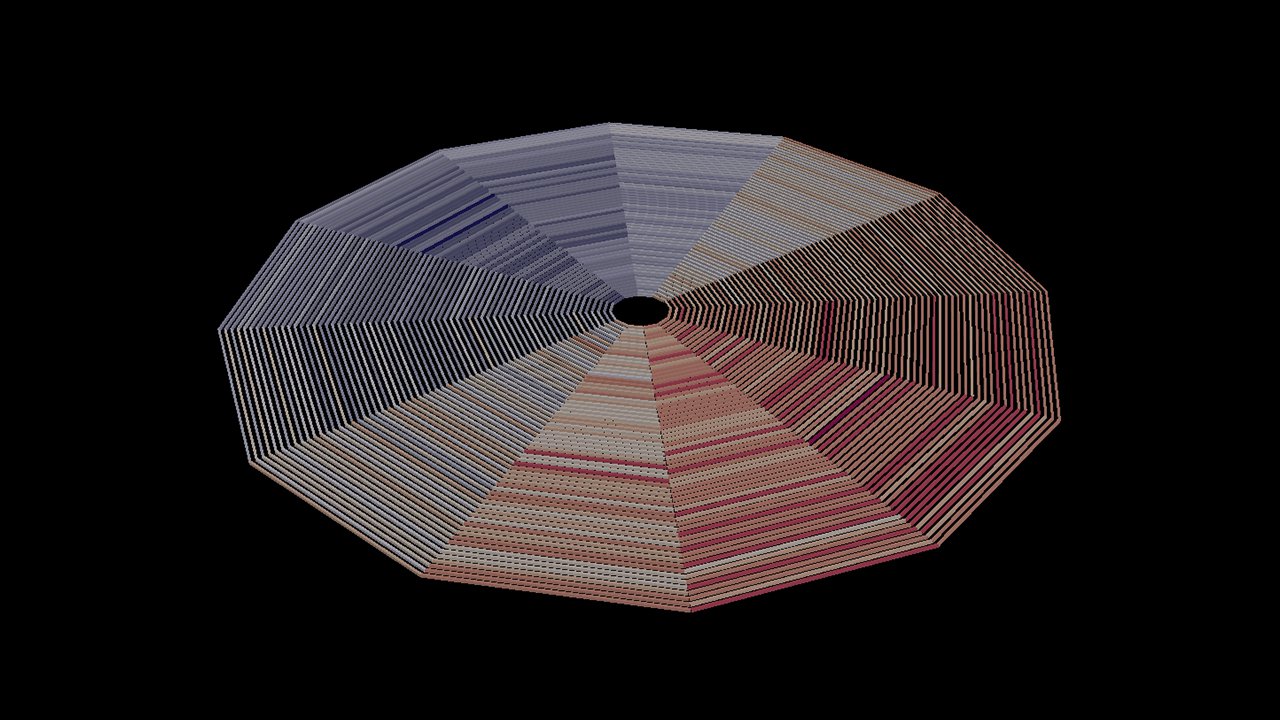

Uniform scale reading from copy number instead of (
1 + $CY * 0.2), not transforming cumulatively
Great! Alternatively, we could have hooked up a point generate SOP to the second input of copy, and used those points to give us a sequence. The advantage of that approach being more control over those points and being able to manipulate them on the fly.
Now to fill in the rest of our data. Back in table import, try adding a few more rows. Rather than manually syncing our row count (x 12) with our number of copies, wouldn’t it be nice to have a single control variable? Even better, how about being able to select a range of years to show? Add a control node anywhere in the network and edit the parameter interface options to hide the default options. Let’s add two float parameters, one for our start year and another for our end year.
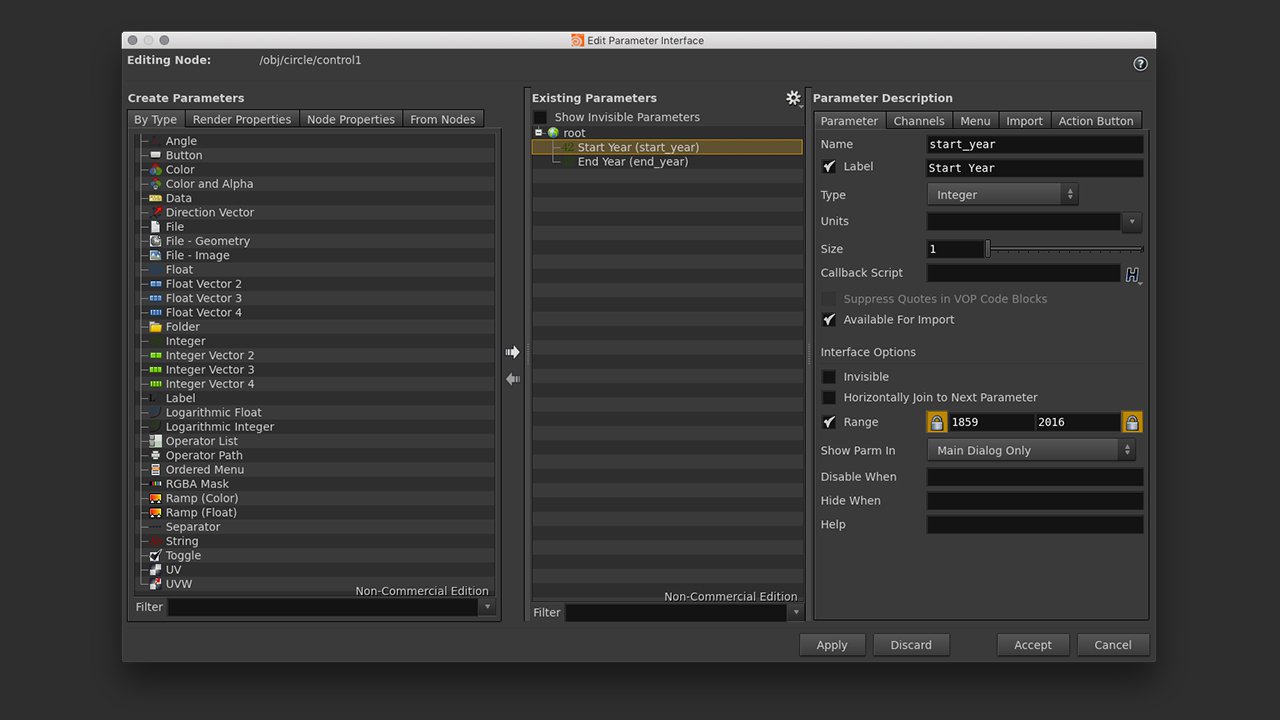

Integer parameters for start and end years
For our system to work, we’ll need to lock our start year values to a range of 1859 to 2016, and for our end year values 1860 to 2017. This will prevent users from accidentally viewing 0 years. Apply these changes and try out your new sliders, although they’re not yet connected to anything.
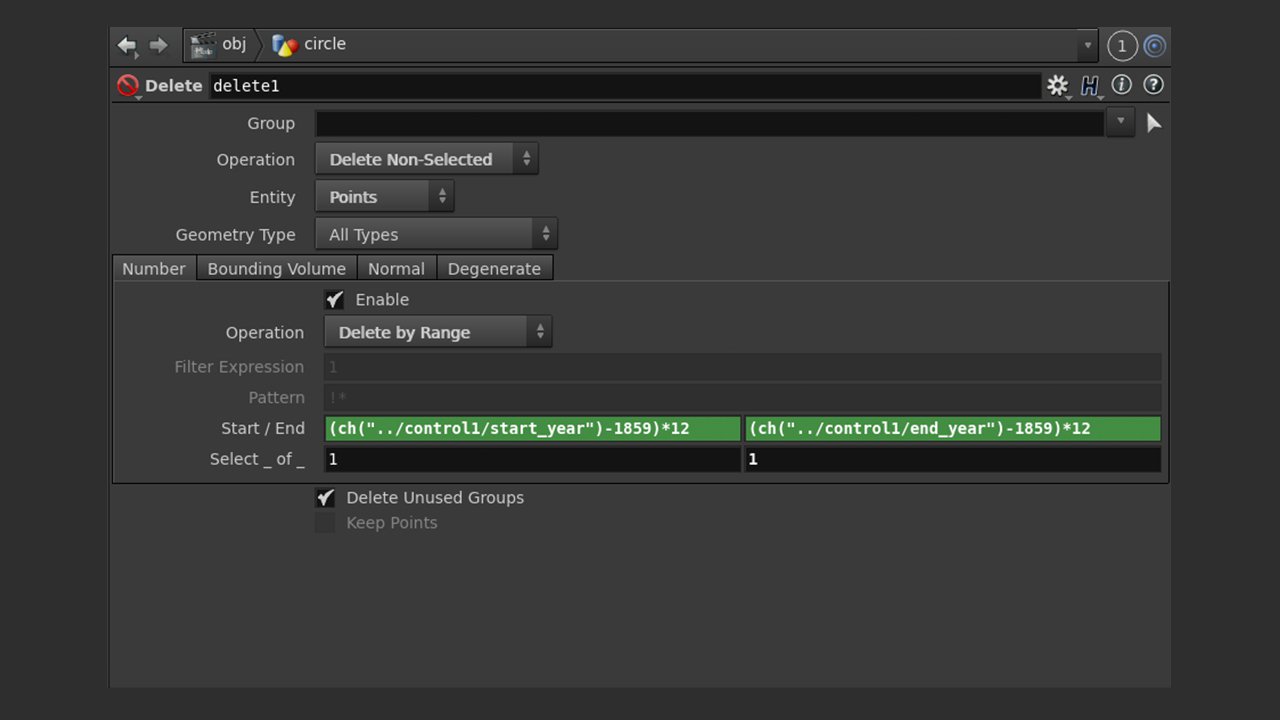

Delete SOP settings to remove points outside our selected year range
Because we essentially want to delete anything that’s not within the selected range, we can just remove the points coming from our table that don’t fit. Connect table import to a delete SOP. Delete can filter out unwanted information for us, so set its parameters to delete non-selected points by range. The first start/end parameters are simply our starting and ending points. Copy and paste the relative values (as we did with resample’s segments) from our control node, into the start and end boxes in delete. Because our control parameters are dealing with years, we’ll have to alter these inputs slightly to work with table rows. First we’ll subtract 1859 from the result to equalise our first row back to zero, then we’ll take this value and multiply by 12 to give us a year. Make sure your parameters equal the values in the image above.
Next we’ll need to apply our end year parameter to table import’s “max rows” in the same way:
(ch("../control1/end_year")-1859) * 12
And also change how we generate copies in the copy SOP. Have a think about this expression before jumping right to the answer. We basically need to have this value equal the difference between our starting and ending years.
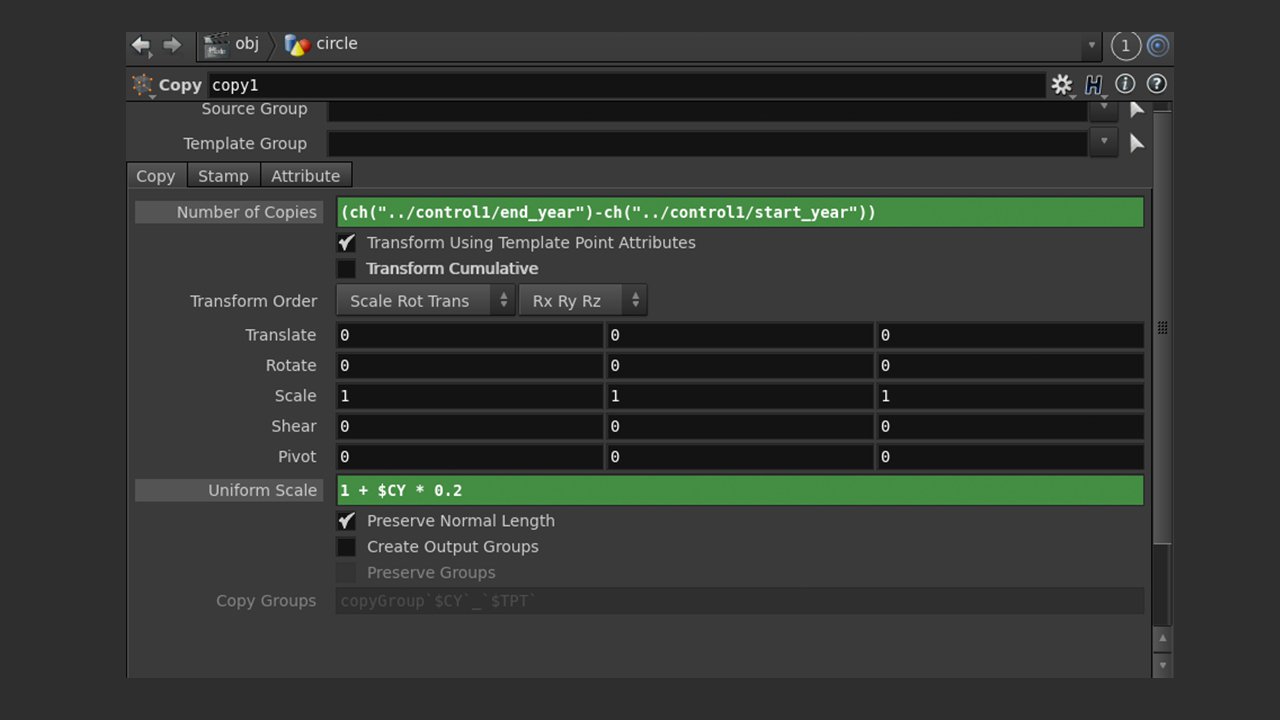

Copy SOP settings
There’s just one more thing to take care of. Right now we’ve got table import bringing in our data, and it’s being sent to delete for filtering. Rather than referencing the delete node every time we want to access the table, connect the delete node to a null node (a useful node that does absolutely nothing) and call it “DATA”. This way we have a less-confusing endpoint to access our CSV with. Head back to our create attribute SOP after the copy node and make sure its value now points to:
point("../DATA", $PR, "temp", 0)
Much better.