Introduction
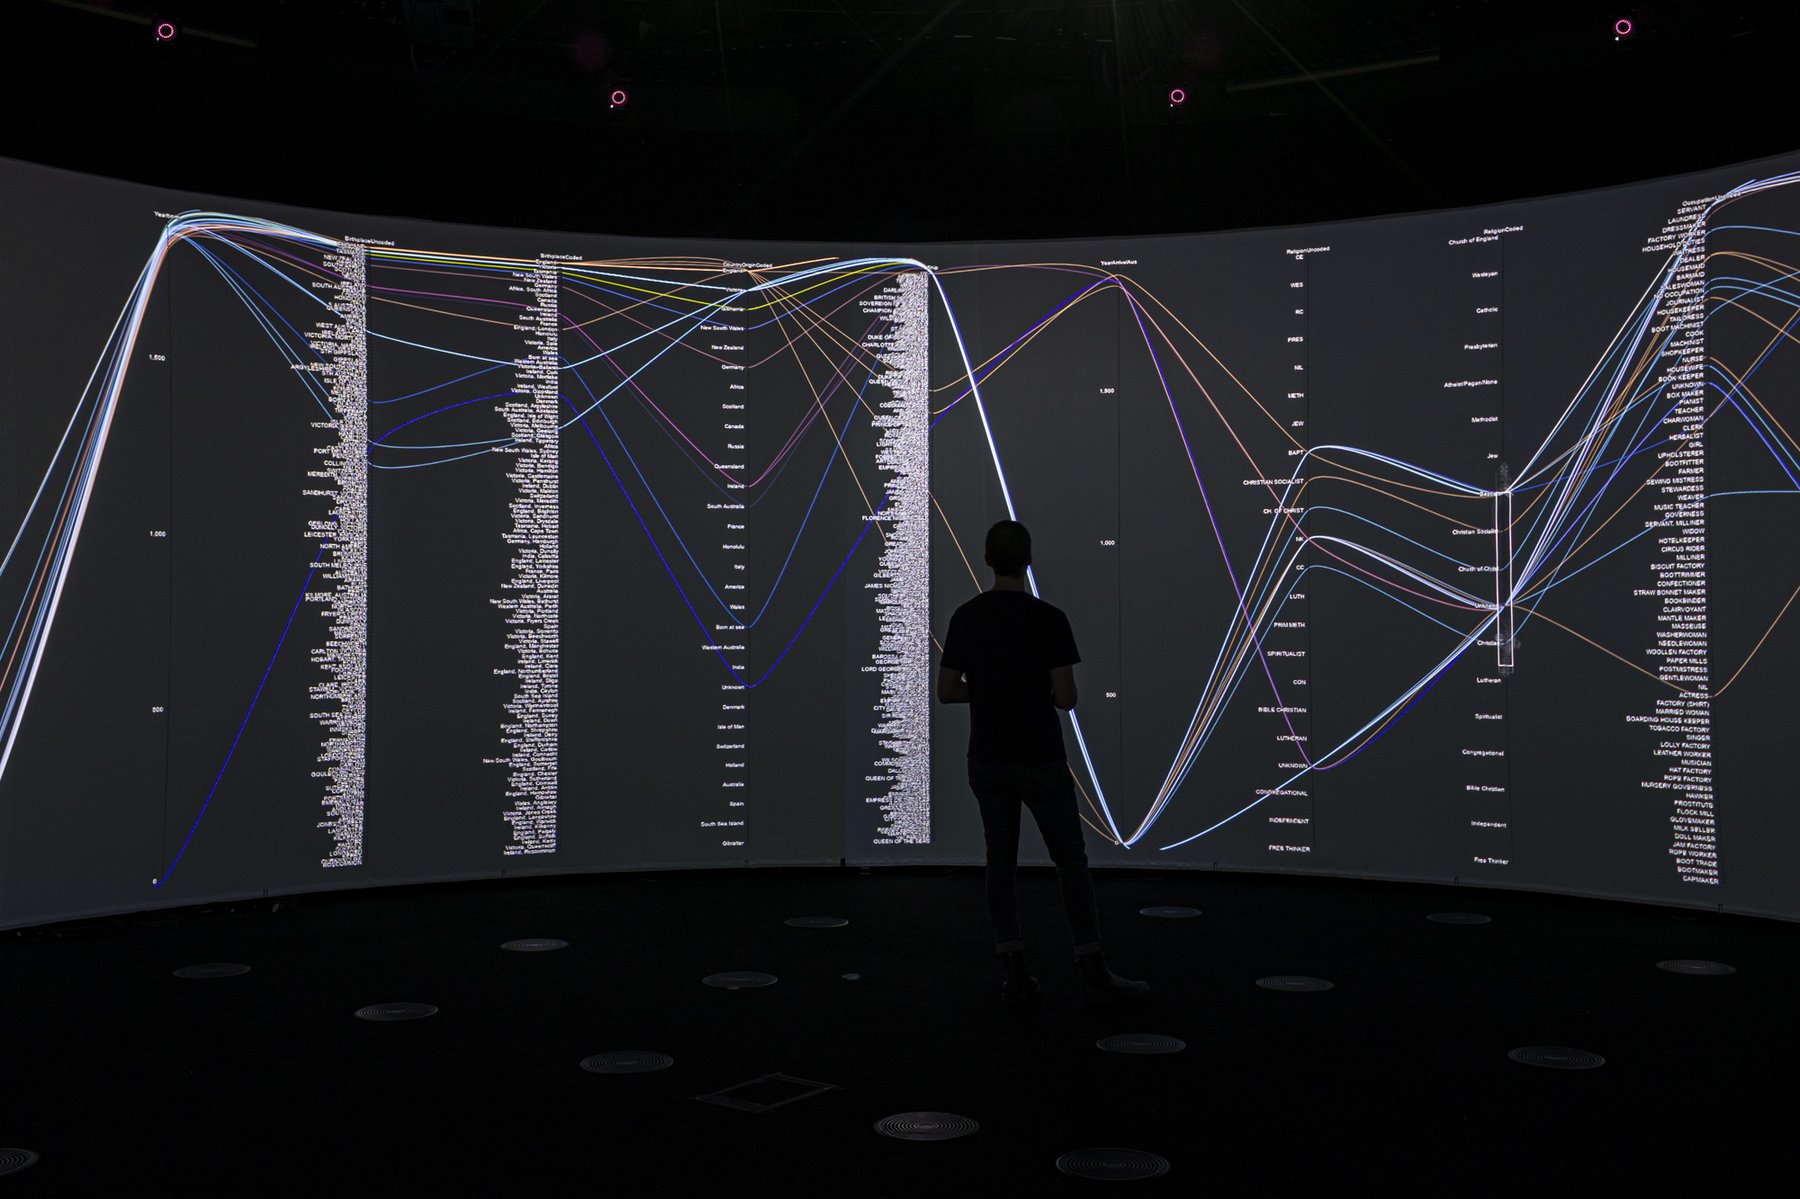
Parallel Coordinates is a very effective and common data visualisation method used to display data across multiple dimensions in a single view. These dimensions are often attributes/variables in a dataset, such as columns in a spreadsheet. Parallel Coordinates is a go-to method for us in the Data Arena as we are able to visualise, interact with and analyse dozens of columns around the theatre.
This short tutorial walks through how to visualise your own CSV data with parallel coordinates. Read on to get started.


Visualisation of Public History Prisoner Data project contributed by Dr Alana Jayne Piper in the Data Arena
Last updated 19 Sep 2022