Add a Data Source
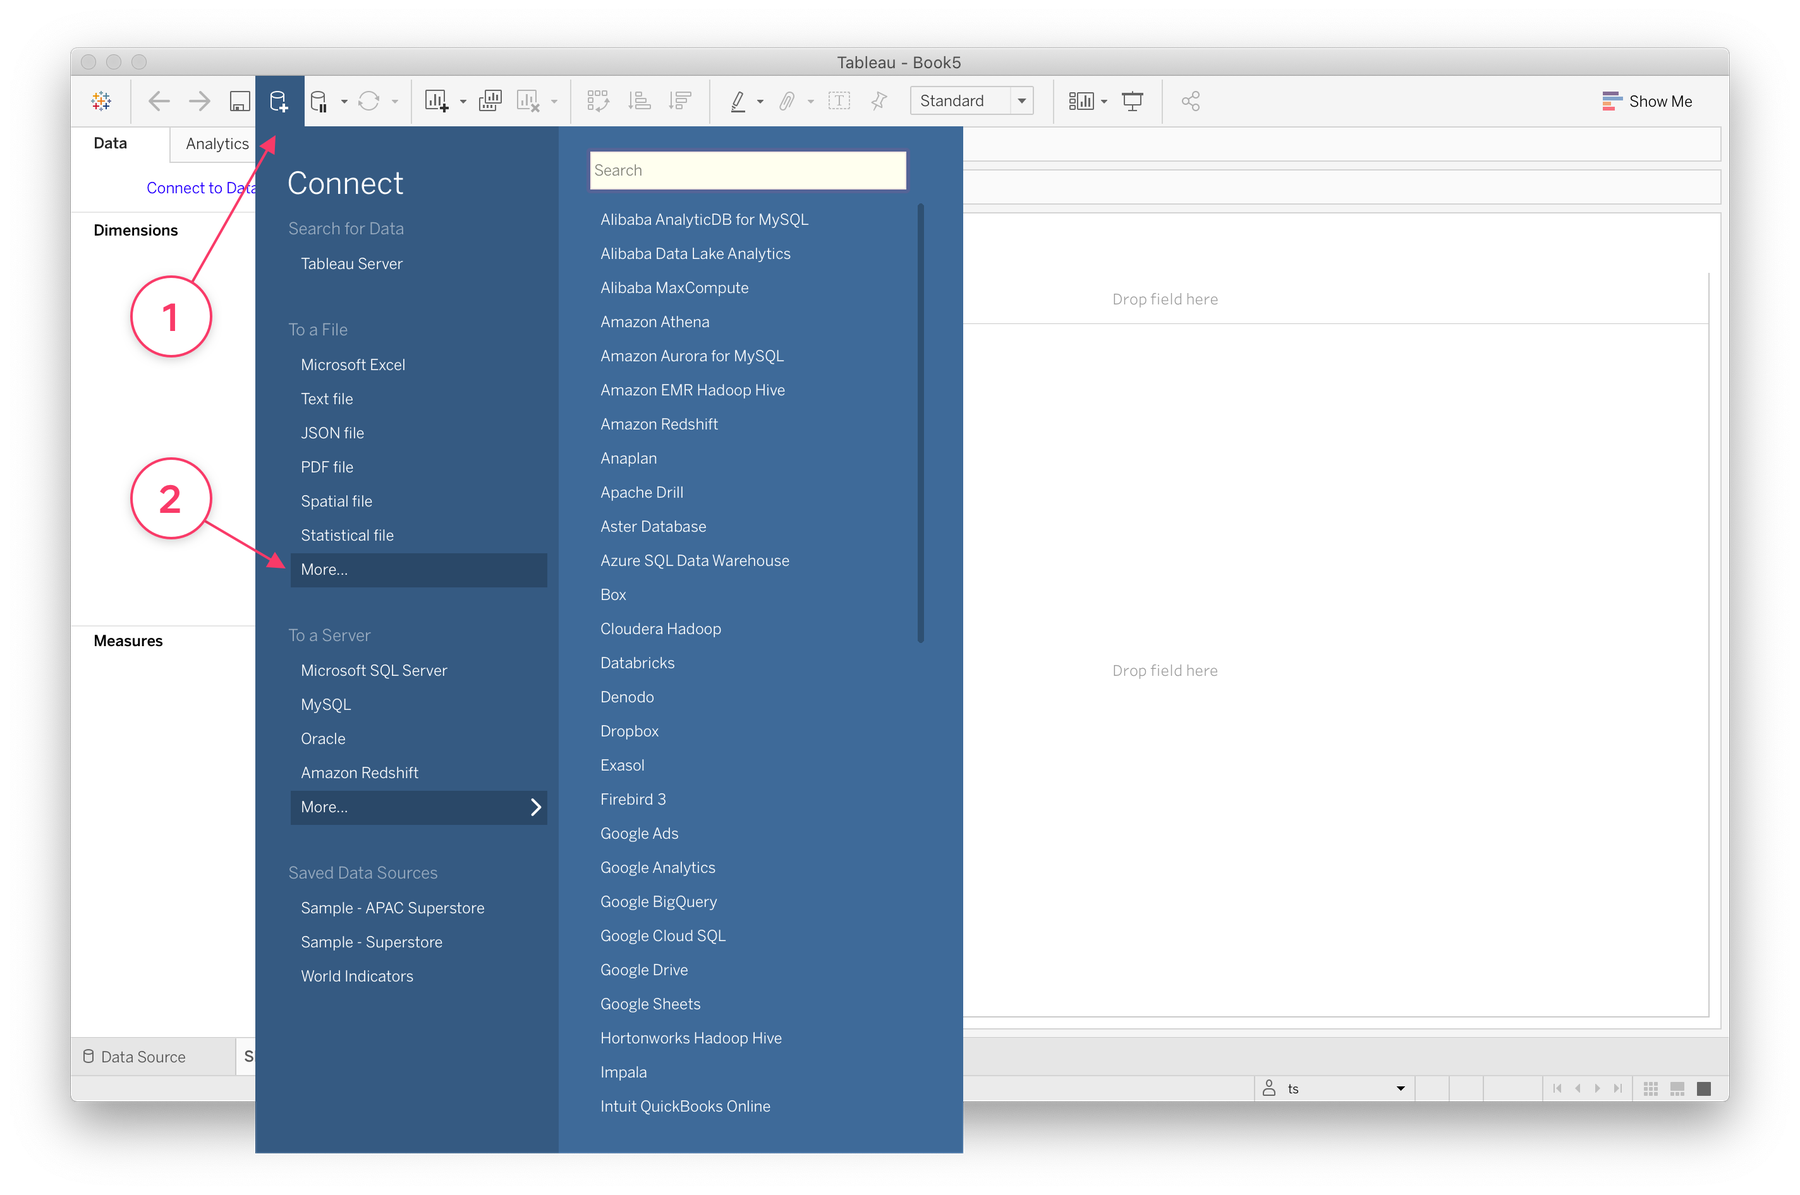
To add a new data source to your workbook, find the New Data Source button or go to Data → New Data Source, then select More... under the To a file section.
Connecting to a data source
Navigate to the covid_19_data.csv file inside the directory you downloaded from Kaggle. Here's the link again if you missed it. Tableau will show you the Data Source tab, where if you wish you can modify the incoming data in a number of ways, unionise it with other data sources and explore other nearby files. We won't need to do any of this so head back to your "Sheet 1" tab.
Sheet with populated data fields
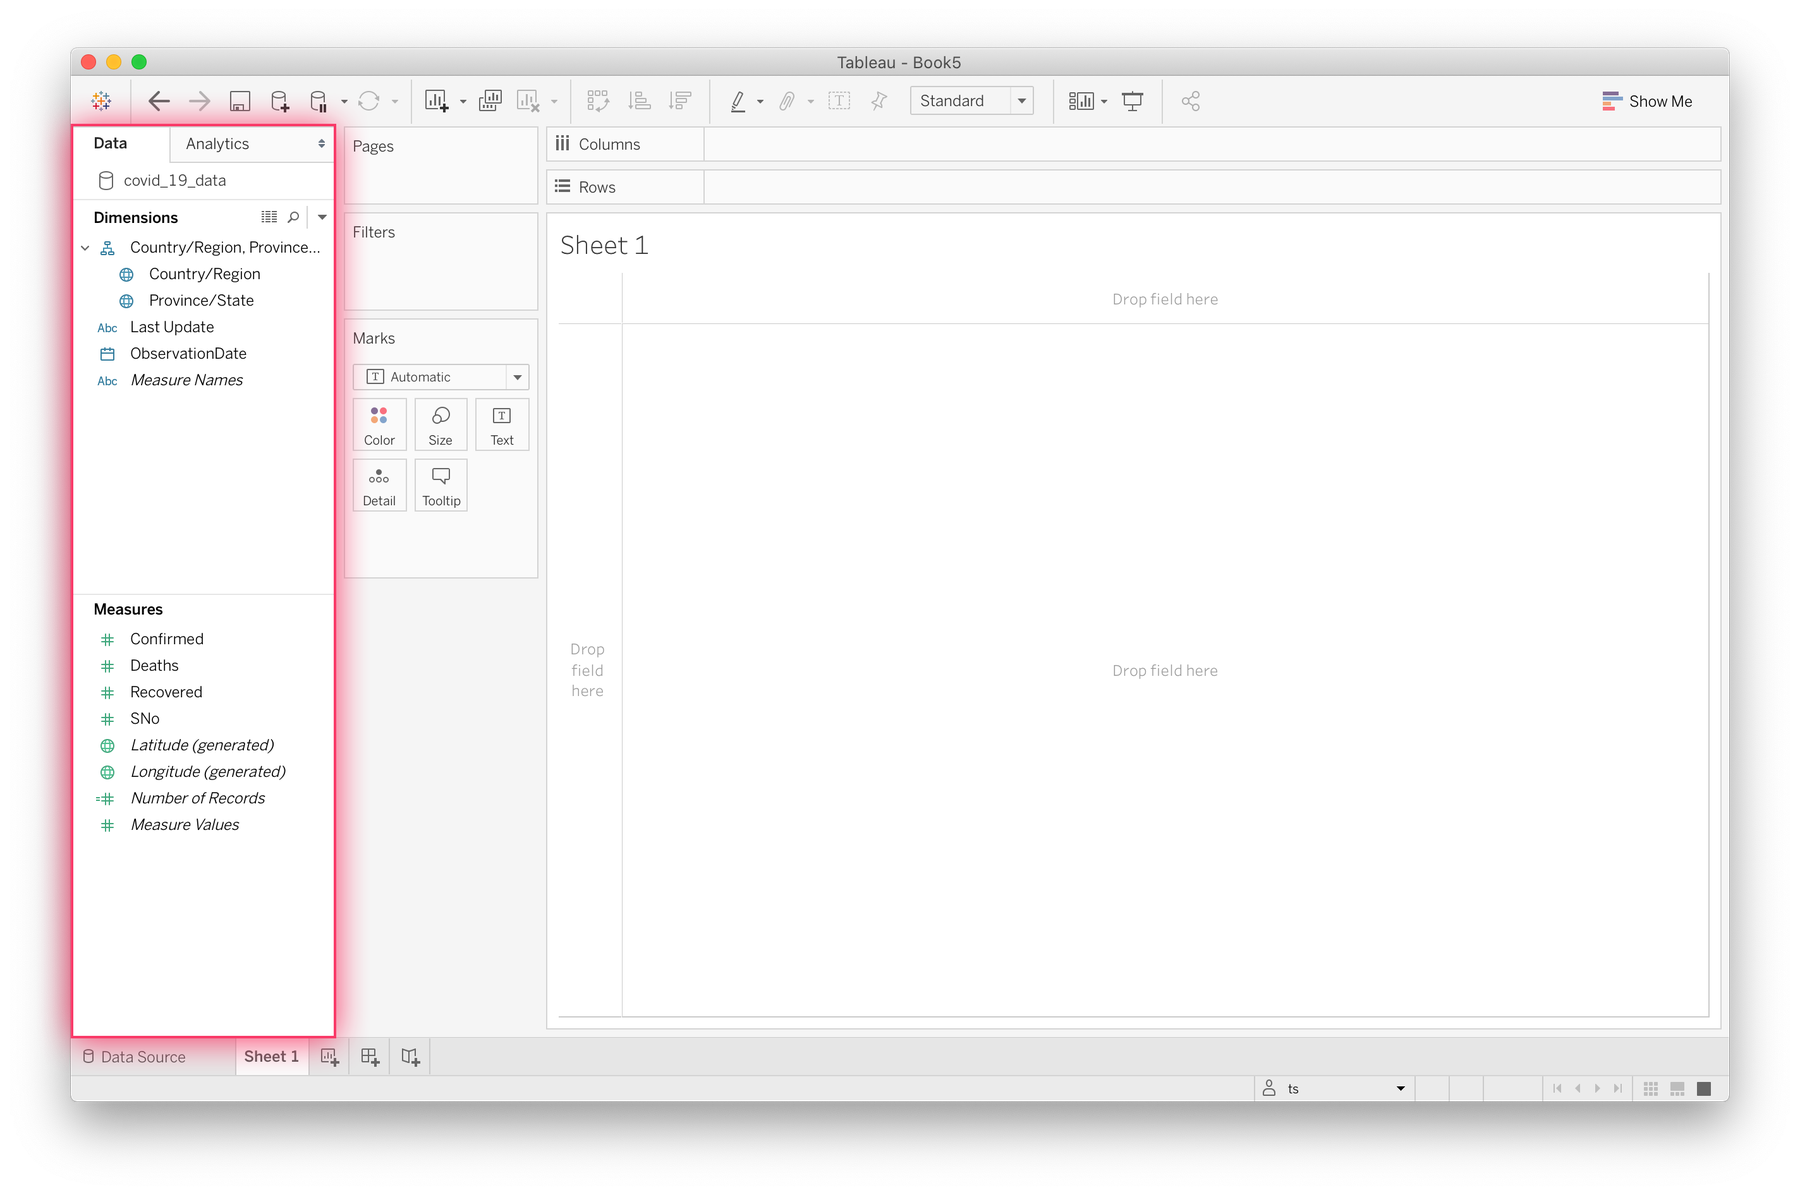
Tableau has now kindly delegated the columns of our dataset into fields within dimensions and measures. If you take a look at these you'll see the difference. Our dimensions are our descrete values that we can use to structure our visualisations and orient our focus (by time, country, province etc). Our measures contain the actual figures that when aligned with our dimensions will give us something interesting to read. Note that Tableau has taken the "Country/Region" locative columns of the dataset and generated Latitude and Longitude fields via geocoding. It's pretty neat.
Now we're ready to start dragging and dropping these fields onto our sheet.