Navigate the Interface
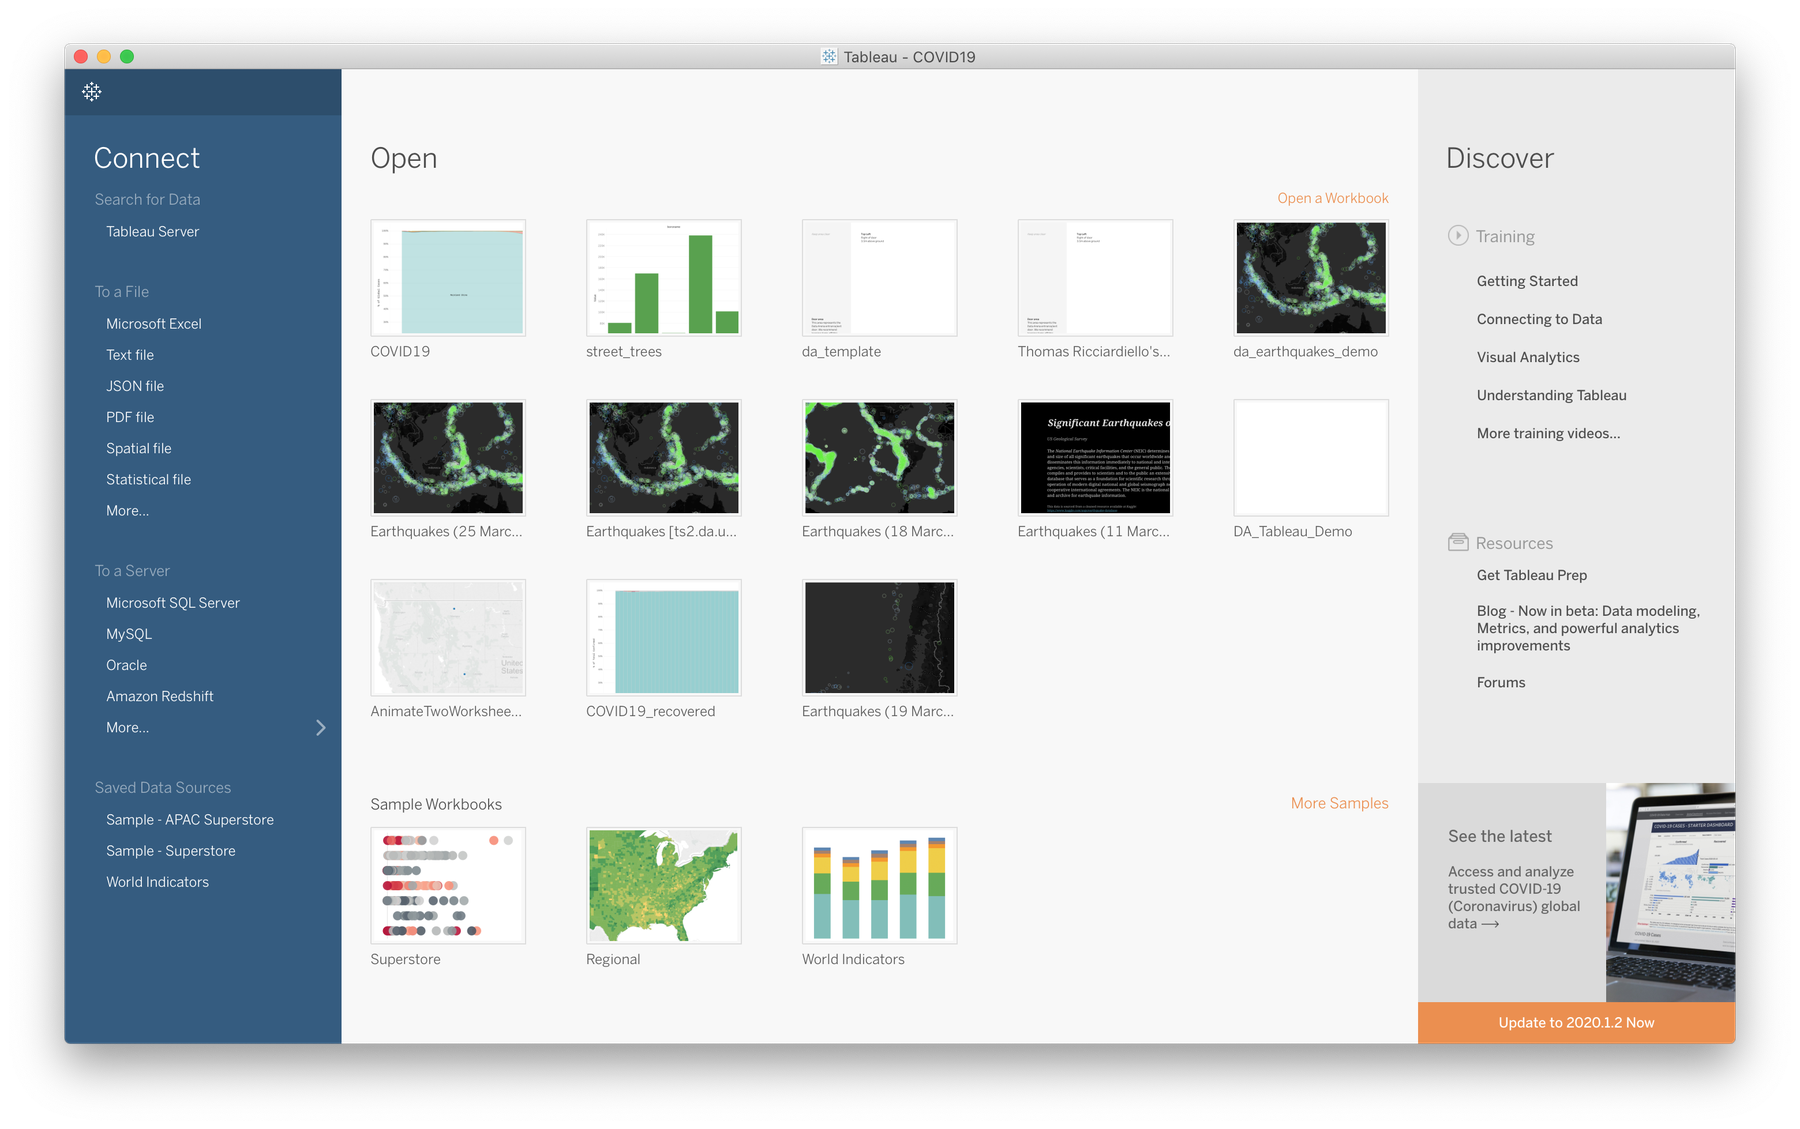
Tableau Desktop's launch screen will show you a number of useful things, most importantly your existing workbooks, as well as links to training material and data repositories. To create a new workbook or "book", choose File → New...


Tableau Desktop's launch interface
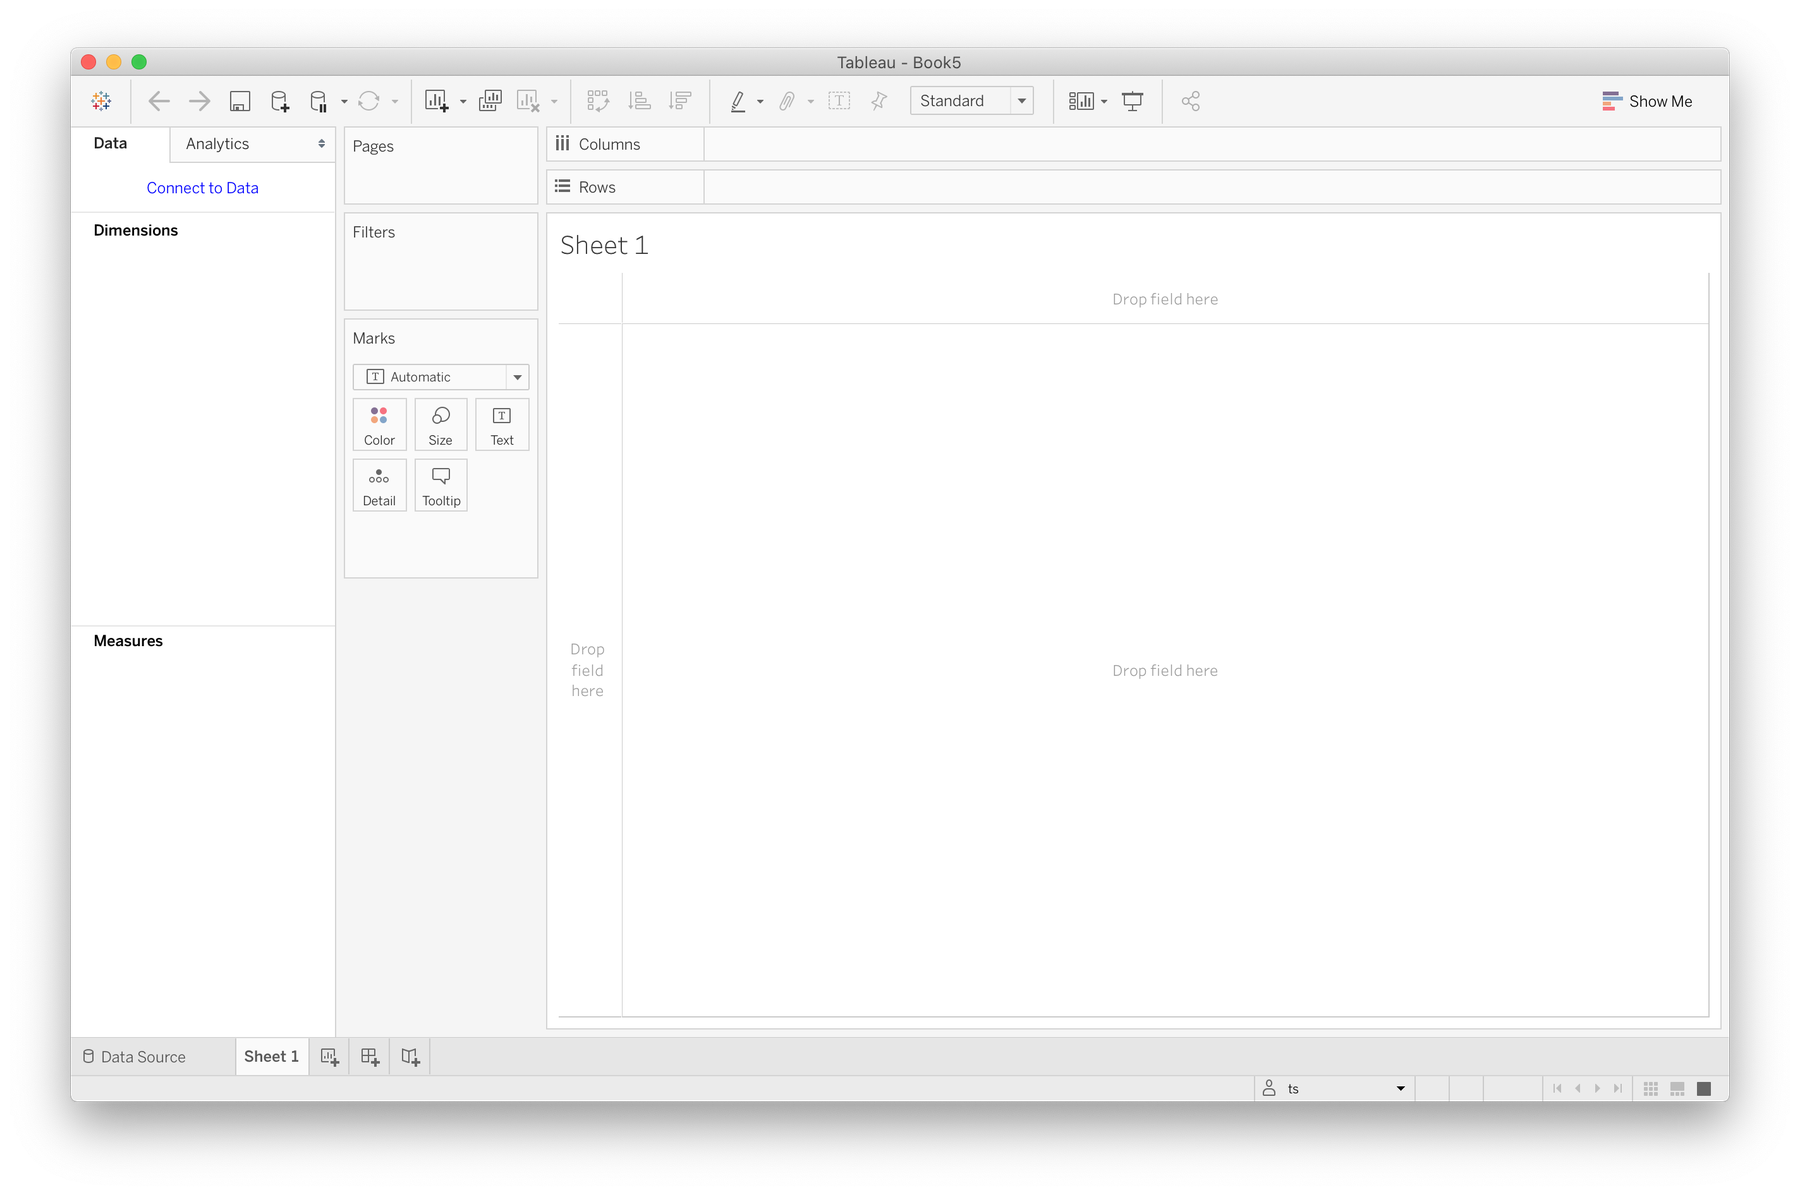
A fresh Tableau workbook starts off with a blank sheet and no data sources. Take a few minutes to scan the interface and notice a few key areas. The very left sidebar is all about your data source(s). When you add a new data source—in our case a CSV file—Tableau automatically splits your columns into dimensions and measures. This is done to help you structure your visualisations. Dimensions are usually the main categorical fields of your visualisation e.g date, country etc (discrete values), that you might orient your visualisation design around. Measures are the actual metrics that give shape to your graphics, so in our case these would be confirmed cases, recoveries and unfortunately deaths (continuous values).


A blank "sheet"
The main blank area on the right is your sheet: the canvas for your visualisation. The default prompts are asking you to define x and y axis for a graph as a way to get started. To the left of this are shelves with numerous applications. The most important to point out is the marks shelf which we'll engage with to control the visual properties of our graphics. Above are spaces to organise our data columns and rows.
Next we'll get started by adding a data source.