MATLAB
MATLAB is a widely-used tool for mathematical computations in numerics, data analysis and visualisation, mostly used by scientists and engineers. If you are looking for some software to model or analyse data, Matlab is a good place to start. There are many toolboxes especially designed for very specific analyses, very specific research areas, and very specific industries. Mathworks list solution examples on their website.
Matlab version R2020b is installed. You can start matlab from the Linux shell with the command:
$ matlab
UTS has a site-wide license for Matlab. We have installed all 95 toolboxes. There are Self-Paced Courses online. Create an Executable Notebook with the MATLAB Live Editor.
How does it help in visualisation?
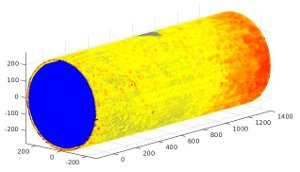
Any data set representing a point cloud can be visualised by using the Computer Vision System Toolbox. For example, we used the 3D Sydney Water Pipe data set.
% dataMatrix: mx3 matrix containing data points
% (x,y,z)
% dataColor: mx3 matrix containing data color
% (RGB from 0 to 255)
ptCloud = pointCloud(dataMatrix, 'Color', dataColor);
figure, pcshow(ptCloud);


Exporting from MATLAB
The same toolbox provides a function to write a .ply file, which can be used to export a point cloud and visualise it in Omegalib using our 3D geometry pipeline. Omegalib has been the traditional way 3D Geometry was displayed. More recently (2020) the Data Arena has been using Unreal Engine to display 3D Geometry. If you're starting a new project, take a look at Unreal Engine instead.
pcwrite(ptCloud,'filename','PLYFormat','binary');
Omegalib: daMatlab
We have developed the Omegalib daMatlab module which is able to directly visualise MATLAB-based geometry in Omegalib.
See our MATLAB tutorial series for further details.